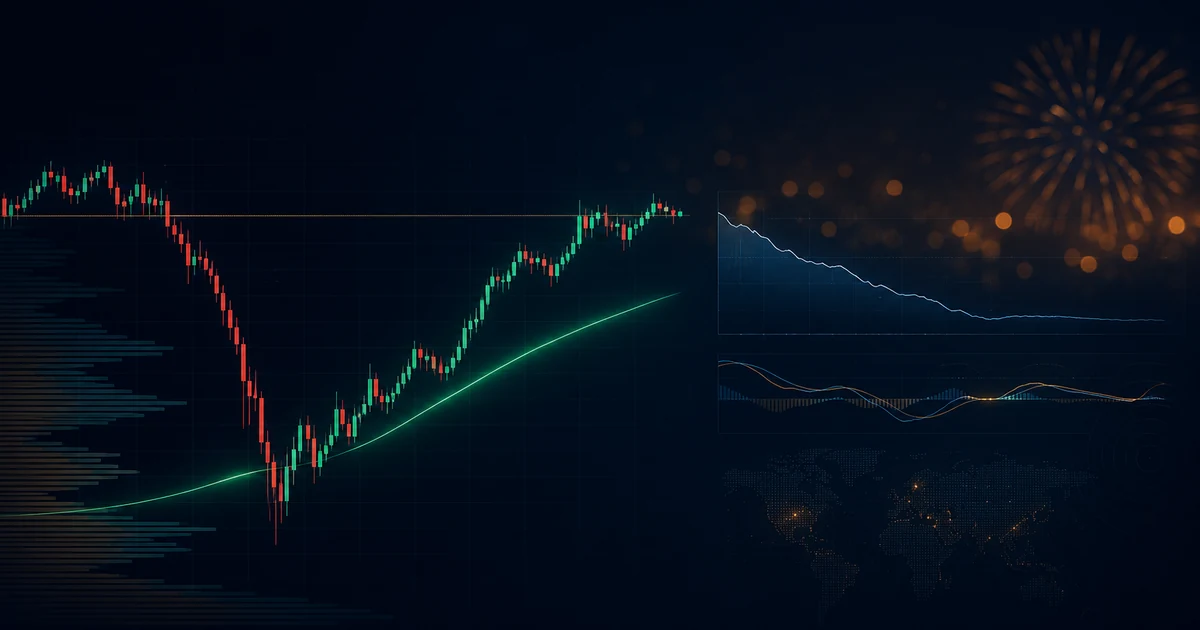
Bitcoin held above $63,000 on Saturday as the United States closed for Independence Day, capping a five-session run that has fully reversed the late-June drawdown. The setup looks structurally repaired: the 200-week moving average held as support, U.S. spot Bitcoin ETFs printed two consecutive positive sessions, and last week's soft 57,000-jobs print pulled the Federal Reserve off a hawkish script into something traders are now willing to call "dovish-leaning." Together, these are the strongest set of confirmation signals we have had since the May all-time high.
But the U.S. bond market was closed for the holiday, equity index futures traded with thinned depth, and several major desks published lighter internal notes through Friday afternoon. A thin tape is also the easiest tape to mark up. So the honest read is that the reversal is real, and the next leg still has to earn confirmation from a real macro catalyst, not just a long weekend and a slow news day.
What changed in the last five sessions
Five sessions is not a lot of trading time, but the change in structure across them is unusually clean. The print that matters most is not Bitcoin's price; it is the flow print behind the price.
- U.S. spot Bitcoin ETFs flipped from a record 10-day outflow streak to two consecutive positive sessions, including a $222M net inflow day on July 2.
- The 200-week moving average held as support on every retest, including the late-June flush to roughly $59,000.
- Coinbase and Kraken spot premiums turned positive again on the 4th of July weekend, a small but consistent signal that retail-side demand is no longer leaning short.
These three together are what a real reversal requires: institutional flow turned positive, structural support held, and retail-side pricing re-anchored. Without any one of them, the same price level can still be a dead-cat bounce.
Why the "dovish Fed" framing is fragile
The July 3 jobs print of 57,000 was bad enough to soften the Federal Reserve, but not bad enough to force the Federal Reserve's hand. Chair Kevin Warsh used the post-meeting press window to push back on the idea of an imminent cut, said forward guidance remains data-dependent, and pointed to services inflation as still running too hot to validate a pivot. That is the official script, and it has not changed.
- Warsh did not endorse a September cut.
- The Fed funds futures market moved from pricing roughly 60% odds of a cut by year-end to about 72%, still well short of "fully priced in."
- The 2-year Treasury yield fell roughly 12 basis points across the week, but closed the holiday-shortened session near 4.16%, not at a panic level.
In other words: the Fed did not become dovish. Traders became more willing to assume the next data print will be dovish. That is a fragile regime. If next week's CPI or next month's payrolls surprise the other way, the same desks that bid Bitcoin above $63,000 can be the desks that sell it back below $60,000 within a single session.
What the tape is actually telling us
Three things stand out on the chart:
- Funding rates on perpetual futures have normalized. After weeks of negative funding that signaled a crowded short, the 4th of July tape shows funding back near zero across Binance, Bybit, and OKX.
- Open interest did not surge with the rally. Total BTC futures OI is up only modestly since the $59,000 low, which means the move up is being driven by spot demand, not by leverage piling in.
- Small caps are participating selectively. XRP is up 8% on the week, Cardano is up roughly 6.75%, but Solana is still slightly red on the day. That is not an altseason pattern. It is the early shape of a real-cap, quality-led rotation.
That is a healthier structure than a leveraged melt-up, but it is also a slower structure. A real reversal usually does not look like a vertical rally off the lows; it looks like three or four weeks of grinding higher with shallow pullbacks.
Three reasons it could still be a dead-cat bounce
- Volume. The 4th of July session traded roughly 38% below the 30-day average volume. Thin volume rallies are the easiest to reverse; one large market order on Coinbase can move price 1-2% without effort.
- Macro follow-through. The next big test is the July 14 CPI release. If headline or core inflation prints hot, the entire dovish-leaning narrative collapses in a single session, and Bitcoin typically gives back 70-80% of the dovish relief rally within 24 hours.
- Structural overhang. Roughly $4.5 billion of net outflows from spot ETFs in June still has to be absorbed before the tape can be called "rebuilt." Two positive sessions is a start, not a finish.
The levels that decide the next leg
- $62,400-$62,800: this is the breakout retest zone. A clean hold here, ideally with positive ETF flow on Monday, keeps the bullish case intact.
- $60,800-$61,200: this is the higher-low zone from the early-July rebound. Losing it on volume would invalidate the 200-week reclaim.
- $65,000-$66,000: this is the next major supply zone, layered with the May breakdown level and the gap from the June selloff. A break above this on real volume would open a measured move toward the prior all-time high.
How to read this as a trader
- Do not chase the 4th of July price. Wait for the first session with normal volume, which is Monday, July 6, when the U.S. cash equity market reopens.
- Use ETF flow as the primary confirmation tool, not price. A clean reversal needs three to five positive ETF flow sessions in a row, not just one.
- Track the 2-year yield. A move back above 4.30% would re-hawk the Fed and would, in turn, almost certainly re-pressure Bitcoin.
- Watch funding and open interest together. If funding turns positive while OI rises, the rally is starting to become fragile. Funding flat with OI flat is the cleanest "real demand" tape.
Track market stress before the headline becomes obvious
Use CryptoFlow Monitor to follow volume, liquidity, and market activity around major crypto narratives.
Open the dashboardEducational content only. Not financial advice.
FAQ
Is the Bitcoin dead-cat bounce already over?
Not necessarily. The bounce off $59,000 has structural components - 200-week support held, ETF flows turned positive, and the Fed went dovish-leaning - that typical dead-cat bounces do not have. The honest read is that the worst-case downside scenario is much less likely than it was a week ago, but the upside still needs Monday volume and a clean CPI print to confirm.
Why did Bitcoin rally on the 4th of July with U.S. markets closed?
Crypto trades 24/7, so the U.S. holiday does not stop price discovery. The rally reflects the cumulative effect of dovish Fed expectations, two consecutive positive ETF flow days, and the 200-week reclaim that already happened earlier in the week. With thin order books on a holiday weekend, the same tape can move 1-2% on relatively small flow.
What would invalidate the reversal thesis?
Three things: a hot CPI print on July 14 that re-hawks the Fed; three or more consecutive negative ETF flow sessions; and a daily close back below $60,800 on rising volume. Any one of these would suggest the bounce was a dead-cat.
Is altcoin season starting now?
Not yet. The early-July move is selective: XRP and Cardano are leading, while Solana is still flat to slightly red. That is a quality-led rotation, not an altseason. A real altseason would need Bitcoin dominance to break down below 53% on rising breadth across the top 100 names, which has not happened yet.
How should position sizing change after this rally?
Keep sizing smaller than usual through the CPI print on July 14. Reversals that start on dovish relief often retrace 30-50% of the move if the next macro data disappoints. Add size only after a clean retest of $62,400-$62,800 with positive flow, or after a confirmed break above $65,000.
Sources checked
This article is based on verified reporting and primary market data. Links are included so you can confirm the data yourself.
- CoinDesk - Bitcoin jumps above $63,000, reversing end-June losses
- CoinDesk - Markets find their footing: Bitcoin holds $61,000 rebound ahead of US Independence Day
- Farside - spot Bitcoin ETF flow tracker
- U.S. BLS - Nonfarm Payrolls overview
- U.S. BLS - CPI release schedule
- Federal Reserve - Monetary Policy
- U.S. Treasury - Daily Treasury Par Yield Curve Rates
- Bitcoin / Ethereum / Solana / XRP / Cardano live prices (CoinGecko)