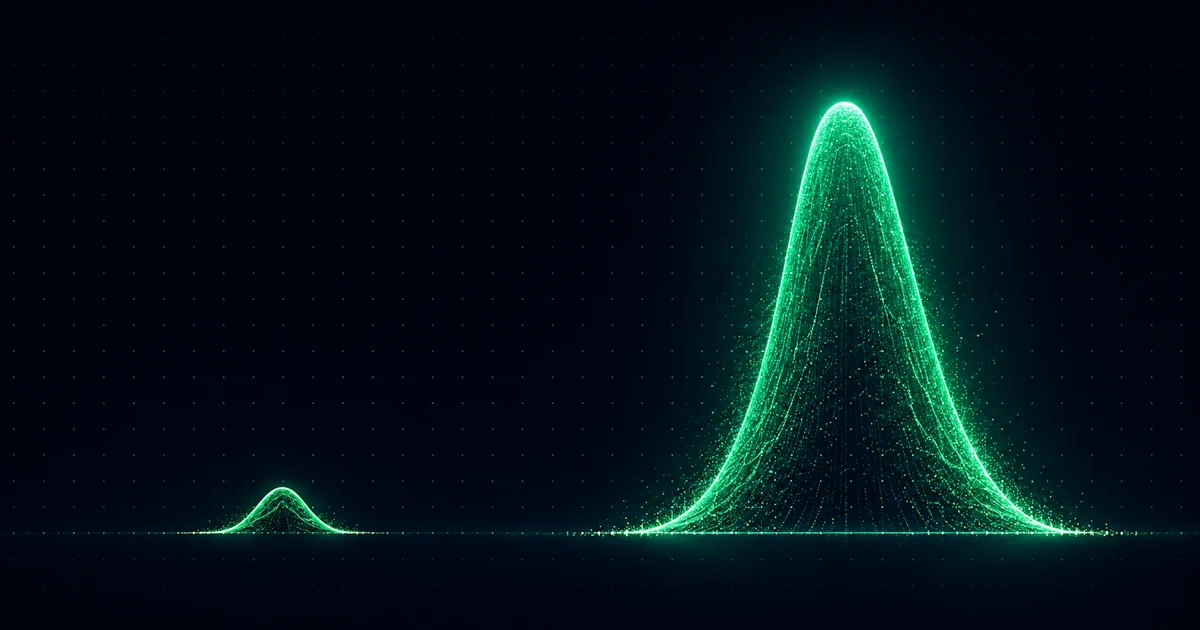
The same fifteen minutes, measured on two books
Every figure in this section was computed from Binance candle data at the time of writing, from closed five minute candles, using the taker buy quote volume divided by the total quote volume. That is the same calculation the live dashboard runs. The only change is that we ran it twice, once on the spot pair and once on the perpetual contract.
| 08:05 to 08:20 UTC | Spot BTCUSDT | Perpetual BTCUSDT | Ratio |
|---|---|---|---|
| Value traded | $140.8 million | $1,973.4 million | 14.0x |
| Taker buy share | 63.0% | 64.2% | almost identical |
| Net aggressive buying | $36.5 million | $561.6 million | 15.4x |
| Share of the combined net | 6.1% | 93.9% |
The middle row is the one that matters for anyone using this site. The buy share is a ratio, and as a ratio it did its job perfectly. It told you that roughly two thirds of the value crossing the spread was buying, and that was true on both venues to within about a point. Someone reading only the spot number would have correctly concluded that buyers were in control of that quarter hour.
They would also have had no way to know that the buying they could see was about a sixteenth of the buying that was actually happening.
الدقائق الخمس عشرة نفسها، مقيسة على دفترين
كل رقم في هذا القسم حُسب من بيانات شموع Binance وقت الكتابة، من شموع خمس دقائق مغلقة، بقسمة حجم الشراء المتلهّف بعملة التسعير على إجمالي الحجم بعملة التسعير. وهي الحسبة نفسها التي تجريها اللوحة الحية. الفارق الوحيد أننا أجريناها مرتين، مرة على الزوج الفوري ومرة على العقد الدائم.
| 08:05 إلى 08:20 UTC | الفوري BTCUSDT | الدائم BTCUSDT | النسبة |
|---|---|---|---|
| القيمة المتداولة | 140.8 مليون دولار | 1,973.4 مليون دولار | 14.0x |
| حصة الشراء المتلهّف | 63.0% | 64.2% | متطابقة تقريباً |
| صافي الشراء المتلهّف | 36.5 مليون دولار | 561.6 مليون دولار | 15.4x |
| الحصة من الصافي المجمّع | 6.1% | 93.9% |
الصف الأوسط هو المهم لمن يستخدم هذا الموقع. حصة الشراء نسبة، وبوصفها نسبة أدّت عملها على أكمل وجه. أخبرتك أن نحو ثلثي القيمة العابرة للسبريد كانت شراء، وهذا صحيح على الدفترين بفارق نقطة واحدة تقريباً. ومن قرأ الرقم الفوري وحده كان سيستنتج بحق أن المشترين سيطروا على ذلك الربع من الساعة.
وكان أيضاً لن يملك أي وسيلة ليعرف أن الشراء الذي يراه يقارب جزءاً من ستة عشر من الشراء الذي كان يحدث فعلاً.
Why the shorts were standing there
Nothing was published at 08:05 UTC. There was no release, no statement, no data print. That is a European morning hour and a Tokyo evening one. So the honest question is what fired, and the answer is a price level and the positions parked around it.
Yesterday's story on this site was the Treasury doubling its long bond buyback operations, which took Bitcoin to a close of $69,335. We reported the price. What we did not do the maths on until today is where that close sat relative to the 200-day moving average, which stood at $69,035.
It was above it. That was the first daily close above the 200-day average since November 2, 2025, ending a run of 289 consecutive closes below it. We computed that from 1,000 daily Binance closes, rolling the average forward one day at a time, rather than comparing today's price to today's average, which is the common way to get this wrong.
A level that has held for two hundred and eighty nine sessions collects orders above it. Some of those orders belong to people who are short and have decided in advance where they will give up.
The positioning data says they were there. At 08:00 UTC the Binance global long/short account ratio on BTCUSDT read 0.9988, which is to say slightly more accounts were short than long, the only reading below parity in the surrounding sessions. By 09:00 it read 1.0777. In one hour the crowd went from marginally short to comfortably long, and it did not get there by changing its mind.
لماذا كان الباعة على المكشوف واقفين هناك
لم يُنشر شيء في 08:05 UTC. لا بيان ولا تصريح ولا رقم اقتصادي. فتلك ساعة صباح أوروبي ومساء طوكيو. والسؤال الأمين إذن هو ما الذي أشعل الحركة، والجواب مستوى سعري والمراكز الرابضة حوله.
كانت قصة الأمس على هذا الموقع مضاعفة الخزانة لعمليات إعادة شراء سنداتها الطويلة، وهو ما رفع البيتكوين إلى إغلاق عند $69,335. أوردنا السعر. لكن ما لم نحسبه حتى اليوم هو موقع ذلك الإغلاق من متوسط المئتي يوم المتحرك، الذي كان عند $69,035.
كان فوقه. وكان ذلك أول إغلاق يومي فوق متوسط المئتي يوم منذ 2 نوفمبر 2025، منهياً سلسلة من 289 إغلاقاً متتالياً تحته. حسبنا ذلك من ألف إغلاق يومي على Binance، بتدوير المتوسط يوماً بيوم، بدل مقارنة سعر اليوم بمتوسط اليوم، وهي الطريقة الشائعة للوقوع في الخطأ هنا.
المستوى الذي صمد مئتين وتسعاً وثمانين جلسة يجمع فوقه أوامر. وبعض تلك الأوامر تخصّ أشخاصاً على المكشوف قرّروا سلفاً أين يستسلمون.
وبيانات المراكز تقول إنهم كانوا هناك. ففي 08:00 UTC قرأت نسبة حسابات الشراء إلى البيع العالمية على BTCUSDT عند 0.9988، أي أن الحسابات المكشوفة كانت أكثر قليلاً من الشرائية، وهي القراءة الوحيدة تحت التعادل في الجلسات المحيطة. وبحلول 09:00 صارت 1.0777. في ساعة واحدة انتقل الجمهور من مكشوف بالكاد إلى شرائي مرتاح، ولم يصل إلى هناك بتغيير رأيه.
Open interest is how you tell covering from conviction
This is the part that separates a squeeze from a rally, and it is measurable rather than rhetorical.
When new buyers open fresh long positions, open interest rises, because a new contract creates a position on both sides of the trade. When existing positions are closed, open interest falls. So the direction of open interest while a price is rising tells you whether you are watching new money arrive or old positions surrender.
| Hour, UTC | BTC price move | Perp open interest | Change | Long/short accounts |
|---|---|---|---|---|
| 07:00 | $69,852 to $69,816 | 110,090 BTC | +0.74% | 1.0101 |
| 08:00 | $69,816 to $71,592 | 110,370 BTC | +0.25% | 0.9988 |
| 09:00 | $71,592 to $71,790 | 108,284 BTC | 1.89% lower | 1.0777 |
| 10:00 | $71,790 to $71,996 | 108,177 BTC | 0.10% lower | 1.0338 |
Price rose 2.54% in the 08:00 hour and open interest fell 1.89% across it. Roughly 2,086 Bitcoin worth of open exposure disappeared while the price was climbing. That is not new conviction being expressed. That is old positions being taken off the board, and since the flow was aggressively buying and the accounts flipped from short to long, the positions coming off were shorts.
The industry figures put a size on it. Short liquidations across crypto reached about $2.7 billion in 24 hours, which CoinGlass records as the largest forced closure of bearish positions since its data starts in 2021. Total liquidations approached $3 billion across roughly 172,108 traders, with shorts about 92% of the damage against roughly $257 million of longs, a ratio above ten to one.
المراكز المفتوحة هي ما يفرّق بين التغطية والقناعة
هذا هو الجزء الذي يفصل الضغطة عن الصعود، وهو قابل للقياس لا للخطابة.
حين يفتح مشترون جدد مراكز شرائية، ترتفع المراكز المفتوحة، لأن العقد الجديد ينشئ مركزاً على طرفي الصفقة. وحين تُغلق مراكز قائمة، تنخفض المراكز المفتوحة. فاتجاه المراكز المفتوحة أثناء صعود السعر يخبرك إن كنت تشاهد أموالاً جديدة تصل أم مراكز قديمة تستسلم.
| الساعة UTC | حركة سعر البيتكوين | المراكز المفتوحة | التغيّر | حسابات شراء/بيع |
|---|---|---|---|---|
| 07:00 | $69,852 إلى $69,816 | 110,090 BTC | +0.74% | 1.0101 |
| 08:00 | $69,816 إلى $71,592 | 110,370 BTC | +0.25% | 0.9988 |
| 09:00 | $71,592 إلى $71,790 | 108,284 BTC | أقل بـ 1.89% | 1.0777 |
| 10:00 | $71,790 إلى $71,996 | 108,177 BTC | أقل بـ 0.10% | 1.0338 |
صعد السعر 2.54% في ساعة الثامنة وانخفضت المراكز المفتوحة 1.89% خلالها. أي أن ما يقارب 2,086 بيتكوين من التعرّض المفتوح اختفى بينما السعر يتسلّق. وهذه ليست قناعة جديدة يجري التعبير عنها، بل مراكز قديمة تُرفع عن الطاولة، ولأن التدفق كان شراء متلهّفاً ولأن الحسابات انقلبت من مكشوفة إلى شرائية، فالمراكز التي رُفعت كانت مكشوفة.
وأرقام القطاع تضع حجماً على ذلك. بلغت تصفيات المراكز المكشوفة في الكريبتو نحو 2.7 مليار دولار خلال 24 ساعة، وهو ما تسجّله CoinGlass كأكبر إغلاق قسري لمراكز هابطة منذ بدء بياناتها في 2021. واقترب إجمالي التصفيات من 3 مليارات دولار عبر نحو 172,108 متداولاً، بحصة للمكشوف نحو 92% مقابل نحو 257 مليون دولار للمراكز الشرائية، بنسبة تفوق عشرة إلى واحد.
The third blind spot, and the running record
Six days ago this site published a piece arguing that our buy share could not see an $853 million ETF week, because ETF creations settle through authorised participants and never cross the Binance spread. Today produced a second, different kind of blindness, and it is worth setting them beside each other rather than treating each as a one off.
| Kind of flow | Where it executes | What our spot buy share shows | Case |
|---|---|---|---|
| ETF creations and redemptions | Authorised participants, off the public book | Nothing. Direction and size both invisible | Aug 14, Aug 16, Aug 17 |
| Futures liquidations | Perpetual order book | Direction right, size understated about fifteen times | Today |
| Ordinary spot demand | The book we measure | Direction and size both correct | The normal case |
These fail differently and that difference is useful. An ETF week gives you a neutral spot reading while price climbs, which is confusing but at least it flags itself: the number looks wrong for the move. A liquidation cascade gives you a reading that looks completely reasonable. Sixty three percent buying on a sharp move up is exactly what you would expect to see. Nothing about the number tells you that you are looking at a sixteenth of the story.
The practical rule we are adopting from today: when Bitcoin moves more than about two percent in an hour and the spot buy share is merely elevated rather than extreme, check whether open interest fell. If it did, the size you are looking at is not the size that moved the price.
النقطة العمياء الثالثة، والسجل الجاري
قبل ستة أيام نشر هذا الموقع مقالاً يقول إن حصة الشراء لدينا لم تستطع رؤية أسبوع صناديق بقيمة 853 مليون دولار، لأن إنشاءات الصناديق تُسوّى عبر المشاركين المعتمدين ولا تعبر سبريد Binance أبداً. واليوم أنتج نوعاً ثانياً مختلفاً من العمى، ويستحق أن يوضع بجانب الأول بدل معاملة كل حالة كحادثة منفردة.
| نوع التدفق | أين يُنفَّذ | ماذا تُظهر حصتنا الفورية | الحالة |
|---|---|---|---|
| إنشاء واسترداد الصناديق | المشاركون المعتمدون، خارج الدفتر العام | لا شيء. الاتجاه والحجم كلاهما غير مرئي | 14 و16 و17 أغسطس |
| تصفيات العقود | دفتر أوامر العقود الدائمة | الاتجاه صحيح، والحجم أقل بنحو خمس عشرة مرة | اليوم |
| الطلب الفوري العادي | الدفتر الذي نقيسه | الاتجاه والحجم كلاهما صحيح | الحالة الطبيعية |
هذان يفشلان بطريقتين مختلفتين، والفرق مفيد. أسبوع الصناديق يعطيك قراءة فورية محايدة بينما السعر يصعد، وهو أمر محيّر لكنه على الأقل يفضح نفسه: الرقم يبدو غير متسق مع الحركة. أما شلال التصفيات فيعطيك قراءة تبدو معقولة تماماً. فثلاثة وستون بالمئة شراءً في حركة صاعدة حادة هو بالضبط ما تتوقع رؤيته. ولا شيء في الرقم يخبرك أنك تنظر إلى جزء من ستة عشر من القصة.
والقاعدة العملية التي نعتمدها من اليوم: حين يتحرك البيتكوين أكثر من اثنين بالمئة تقريباً في ساعة وتكون حصة الشراء الفورية مرتفعة لا متطرفة، تحقّق مما إذا كانت المراكز المفتوحة قد انخفضت. فإن انخفضت، فالحجم الذي تنظر إليه ليس الحجم الذي حرّك السعر.
What today was not
Yesterday every risk asset on the board went up together, gold and silver included, and we said that pattern pointed at the discount rate rather than at anything to do with blockchains. That test is worth running again today, because today it fails.
Tokenised gold on Binance is up 0.55% over 24 hours. Yesterday it was up about 3.5%. Bitcoin is up 5.56%, Ether 11.22%, XRP 18.13%. When crypto moves five to eighteen percent and gold moves half a percent, the thing that changed is not the price of money.
The monetary news, in fact, went the other way. The FOMC minutes from the July 28 and 29 meeting were released at 18:00 UTC yesterday, which was after we published. They showed the hawkish side was larger than the vote suggested. Three regional presidents dissented in favour of a quarter point hike, which was already known, but the minutes and subsequent reporting indicated that Kansas City's Jeffrey Schmid and St Louis's Alberto Musalem, neither voting in July, would also have backed an increase. That is five officials leaning towards higher rates, against a 9 to 3 hold.
Crypto rose anyway, and it rose while gold sat still. Both of those facts point the same way: this was a positioning event and a policy headline, not a macro repricing.
One correction of emphasis on yesterday's piece, while we are here. We wrote that the Treasury had fixed the long end. The official Treasury close for August 19 confirms the 30-year at 5.19%, down from 5.28%, so the move was real. But Thursday's official close is not published at the time of writing, and market reporting through the session described long yields as rising again. One day does not fix a fiscal problem, and we should have said "relieved" rather than "fixed".
ما لم يكنه اليوم
بالأمس صعد كل أصل خطر على اللوحة معاً، والذهب والفضة ضمنها، وقلنا إن ذلك النمط يشير إلى سعر الخصم لا إلى أي شيء يخصّ البلوكتشين. ويستحق ذلك الاختبار أن يُعاد اليوم، لأنه اليوم يسقط.
الذهب المرمّز على Binance صاعد 0.55% خلال 24 ساعة. وبالأمس كان صاعداً نحو 3.5%. أما البيتكوين فصاعد 5.56%، والإيثيريوم 11.22%، والريبل 18.13%. وحين يتحرك الكريبتو بين خمسة وثمانية عشر بالمئة ويتحرك الذهب نصف بالمئة، فالذي تغيّر ليس سعر النقود.
بل إن الخبر النقدي ذهب في الاتجاه المعاكس. فقد صدر محضر اللجنة الفيدرالية عن اجتماع 28 و29 يوليو في 18:00 UTC أمس، أي بعد نشرنا. وأظهر أن الجناح المتشدد أكبر مما أوحى به التصويت. فقد خالف ثلاثة رؤساء بنوك إقليمية لصالح رفع ربع نقطة، وهذا كان معروفاً، لكن المحضر والتغطية اللاحقة أشارا إلى أن جيفري شميد من كانساس سيتي وألبرتو موساليم من سانت لويس، ولم يكن أي منهما مصوّتاً في يوليو، كانا سيدعمان الرفع أيضاً. أي خمسة مسؤولين يميلون إلى فائدة أعلى، مقابل تثبيت بنتيجة 9 مقابل 3.
وصعد الكريبتو رغم ذلك، وصعد بينما الذهب ساكن. وكلتا الحقيقتين تشيران إلى الجهة نفسها: كان هذا حدث مراكز وعنوان سياسي، لا إعادة تسعير كلية.
وتصويب واحد في التشديد على مقال الأمس ما دمنا هنا. كتبنا أن الخزانة أصلحت الطرف الطويل. الإغلاق الرسمي للخزانة ليوم 19 أغسطس يؤكد الثلاثين عاماً عند 5.19%، نزولاً من 5.28%، فالحركة حقيقية. لكن إغلاق الخميس الرسمي غير منشور وقت الكتابة، وتغطية السوق خلال الجلسة وصفت عوائد الأجل الطويل بأنها تصعد مجدداً. ويوم واحد لا يصلح مشكلة مالية، وكان الأولى أن نقول "خفّفت" بدل "أصلحت".
CLARITY, for the fourth time, is a calendar story
The headline everyone attached to this move was President Trump convening crypto executives and regulators at the White House on August 19 and urging the Senate to pass the CLARITY Act, calling for "a fair version" of the bill.
On August 2 this site argued that crypto legislation moves on the calendar rather than on its content. On August 3 we wrote that CLARITY needs seven Democrats and that Bitcoin was rising on the attempt, not the outcome. On August 17 we extended the same logic from Congress to the SEC when it cancelled its own vote. Today is the fourth instance and nothing about it breaks the pattern.
What changed yesterday was that the President asked. What did not change: the bill is still deadlocked in the Senate over ethics provisions that would restrict public officials from profiting personally from crypto, Republicans still resist those provisions as targeted, and the Senate is in recess until September. No vote has been scheduled. No Democrat has moved.
So the position we have held for three weeks stands unchanged: the market keeps paying for the attempt. It has now done so four times without a law existing. We are not going to pretend the fourth time means something the first three did not.
كلاريتي، وللمرة الرابعة، قصة تقويم
العنوان الذي ربطه الجميع بهذه الحركة هو دعوة الرئيس ترامب تنفيذيي الكريبتو والجهات التنظيمية إلى البيت الأبيض في 19 أغسطس، وحثّه مجلس الشيوخ على تمرير قانون كلاريتي، مطالباً بـ"نسخة عادلة" من مشروع القانون.
في 2 أغسطس قال هذا الموقع إن تشريعات الكريبتو تتحرك بالتقويم لا بمضمونها. وفي 3 أغسطس كتبنا أن كلاريتي يحتاج سبعة ديمقراطيين وأن البيتكوين يصعد على المحاولة لا على النتيجة. وفي 17 أغسطس مددنا المنطق نفسه من الكونغرس إلى هيئة الأوراق المالية حين ألغت تصويتها الخاص. واليوم هو الحالة الرابعة ولا شيء فيها يكسر النمط.
ما تغيّر أمس أن الرئيس طلب. وما لم يتغيّر: مشروع القانون ما زال معطّلاً في مجلس الشيوخ بسبب بنود أخلاقية تقيّد استفادة المسؤولين العموميين شخصياً من الكريبتو، وما زال الجمهوريون يقاومون تلك البنود بوصفها موجّهة، ومجلس الشيوخ في عطلة حتى سبتمبر. لم يُحدَّد أي تصويت. ولم يتحرك أي ديمقراطي.
فالموقف الذي نحمله منذ ثلاثة أسابيع يبقى دون تغيير: السوق يواصل الدفع مقابل المحاولة. وقد فعل ذلك أربع مرات حتى الآن دون وجود قانون. ولن ندّعي أن المرة الرابعة تعني شيئاً لم تعنه المرات الثلاث السابقة.
The flows our spot tape never records
Separately from anything forced, the unforced demand also arrived, and it arrived on the settlement rails we have spent a week explaining that we cannot see.
| August 19 net flow | Amount | Note |
|---|---|---|
| US spot Bitcoin ETFs | $517.19 million | Largest single day since May 4 |
| BlackRock IBIT | $284.7 million | About 55% of the total |
| ARK 21Shares ARKB | $77.7 million | |
| Fidelity FBTC | $62.4 million | Eight of twelve funds positive |
| US spot Ether ETFs | $189.15 million | Largest since October 28, 2025 |
| BlackRock ETHA | $122.12 million | About 65% of the Ether total |
Two details are worth keeping. First, eight of the twelve Bitcoin funds took money, which is a different picture from one fund absorbing a single large ticket. Second, the Ether figure is the strongest since October 2025 and lifts the month to about $534 million, the best of the year for those funds.
And one caution we have earned the hard way. Yesterday's article had to report that Monday's flow was first published as $137.3 million and finally settled at $297.5 million once BlackRock's data was included. Early ETF prints are partial. Treat any same day figure as provisional until the consolidated number lands.
التدفقات التي لا يسجّلها شريطنا الفوري أبداً
بمعزل عن أي شيء قسري، وصل الطلب غير القسري أيضاً، ووصل على سكك التسوية التي أمضينا أسبوعاً نشرح أننا لا نراها.
| صافي تدفق 19 أغسطس | المبلغ | ملاحظة |
|---|---|---|
| صناديق البيتكوين الفورية الأمريكية | 517.19 مليون دولار | أكبر يوم منفرد منذ 4 مايو |
| بلاك روك IBIT | 284.7 مليون دولار | نحو 55% من الإجمالي |
| آرك ARKB | 77.7 مليون دولار | |
| فيديليتي FBTC | 62.4 مليون دولار | ثمانية من اثني عشر صندوقاً موجبة |
| صناديق الإيثيريوم الفورية | 189.15 مليون دولار | الأكبر منذ 28 أكتوبر 2025 |
| بلاك روك ETHA | 122.12 مليون دولار | نحو 65% من إجمالي الإيثيريوم |
تفصيلتان تستحقان الحفظ. الأولى أن ثمانية من اثني عشر صندوق بيتكوين استقبلت أموالاً، وهذه صورة مختلفة عن صندوق واحد يستوعب تذكرة كبيرة منفردة. والثانية أن رقم الإيثيريوم هو الأقوى منذ أكتوبر 2025 ويرفع الشهر إلى نحو 534 مليون دولار، وهو الأفضل هذا العام لتلك الصناديق.
وتحذير واحد تعلّمناه بالطريقة الصعبة. اضطر مقال الأمس إلى الإبلاغ بأن تدفق الاثنين نُشر أولاً عند 137.3 مليون دولار واستقر أخيراً عند 297.5 مليون دولار بعد إدراج بيانات بلاك روك. فطبعات الصناديق المبكرة جزئية. عامل أي رقم صادر في اليوم نفسه كرقم مؤقت حتى يصل الرقم الموحّد.
Where things stand
| Asset | Price | 24h | Note |
|---|---|---|---|
| Bitcoin | $72,370 | +5.56% | High $72,830, the highest since June 1 |
| Ether | $2,320.97 | +11.22% | Above any close since May 11 |
| XRP | $1.2588 | +18.13% | Above any close since June 1 |
| Solana | $87.26 | +6.75% | |
| BNB | $650.96 | +5.52% | |
| Dogecoin | $0.07986 | +10.20% | |
| Tokenised gold | $4,512 | +0.55% | The one that did not join |
Total crypto market capitalisation is $2.474 trillion, up 3.05%, with Bitcoin dominance at 58.56% and Ether at 11.30%. The Fear and Greed index reads 62, Greed, against 46 yesterday, 41 on Tuesday and 31 on Monday. That is a thirty one point swing in four sessions, which says more about how fast sentiment surveys follow price than about anything else.
The ETH to BTC ratio is 0.03210, up 5.0% on the day. We reported it above 0.03 yesterday and we are reporting it again today. Two observations are not a trend and we will not describe them as one.
On the funding side, one number argues against reading euphoria into this. The BTCUSDT perpetual funding rate settled at 0.0094% at 16:00 UTC, essentially the venue's baseline. After a 5.56% day and a record short squeeze, longs are not paying an unusual premium to stay long.
Volume figures for August 20 in this article cover 00:00 to just past 16:00 UTC and are therefore partial. On that partial basis, spot BTCUSDT has traded $2.06 billion at a 51.2% buy share while the perpetual has traded $16.52 billion at 53.1%. Note what those whole day numbers do to the story: averaged across seventeen hours, both venues look like a coin flip. The entire character of the day lives in fifteen minutes.
حيث تقف الأمور
| الأصل | السعر | 24 ساعة | ملاحظة |
|---|---|---|---|
| بيتكوين | $72,370 | +5.56% | أعلى $72,830، الأعلى منذ 1 يونيو |
| إيثيريوم | $2,320.97 | +11.22% | فوق أي إغلاق منذ 11 مايو |
| ريبل | $1.2588 | +18.13% | فوق أي إغلاق منذ 1 يونيو |
| سولانا | $87.26 | +6.75% | |
| بينانس كوين | $650.96 | +5.52% | |
| دوجكوين | $0.07986 | +10.20% | |
| الذهب المرمّز | $4,512 | +0.55% | الوحيد الذي لم يشارك |
إجمالي القيمة السوقية للكريبتو 2.474 تريليون دولار، صاعداً 3.05%، بهيمنة للبيتكوين عند 58.56% وللإيثيريوم عند 11.30%. ومؤشر الخوف والطمع يقرأ 62، طمع، مقابل 46 أمس و41 الثلاثاء و31 الاثنين. أي تحوّل بواحد وثلاثين نقطة في أربع جلسات، وهو يقول عن سرعة لحاق مسوح المشاعر بالسعر أكثر مما يقول عن أي شيء آخر.
ونسبة الإيثيريوم إلى البيتكوين 0.03210، صاعدة 5.0% في اليوم. أوردناها فوق 0.03 أمس ونوردها مرة أخرى اليوم. ملاحظتان لا تصنعان اتجاهاً ولن نصفهما كذلك.
وعلى جانب التمويل، رقم واحد يعارض قراءة النشوة في هذا. فقد استقر معدل تمويل عقد BTCUSDT الدائم عند 0.0094% في 16:00 UTC، وهو أساساً خط الأساس في المنصة. بعد يوم بنسبة 5.56% وضغطة قياسية على المكشوف، لا يدفع أصحاب المراكز الشرائية علاوة غير عادية للبقاء.
أرقام الحجم ليوم 20 أغسطس في هذا المقال تغطي من 00:00 إلى ما بعد 16:00 UTC بقليل وهي بالتالي جزئية. وعلى هذا الأساس الجزئي، تداول الزوج الفوري BTCUSDT 2.06 مليار دولار بحصة شراء 51.2% بينما تداول العقد الدائم 16.52 مليار دولار بنسبة 53.1%. ولاحظ ما تفعله أرقام اليوم الكامل هذه بالقصة: بالمتوسط على سبع عشرة ساعة، يبدو الدفتران كرمي عملة. وطابع اليوم بأكمله يسكن في خمس عشرة دقيقة.
What we are not saying
We are not saying the rally continues. A squeeze is buying that has to happen whatever the buyer believes, and it ends when the positions are gone. Roughly $2.7 billion of shorts have already been closed, which means that particular fuel has been spent rather than stored.
We are not setting a level. This site retired directional thresholds on August 3 after watching two of our own if then conditions fire in opposite directions within three days. The buy share describes the window it measures. It does not forecast the next one, and today it did not even measure the whole of the window it appeared to.
We are not calling the 200-day average reclaimed as a state of affairs. One close above a level that held for 289 sessions is one close. It is a fact worth knowing and it is not a trend.
What we are saying is narrower and, we think, more useful. On a day when our own headline metric would have led a careful reader to a reasonable but badly undersized conclusion, the correction came from a second measurement on a second venue and from open interest. That is a method, not a prediction, and it is available to anyone with the same public API.
ما لا نقوله
لا نقول إن الصعود مستمر. فالضغطة شراء يجب أن يحدث أياً كان ما يعتقده المشتري، وتنتهي حين تنتهي المراكز. وقد أُغلق فعلاً نحو 2.7 مليار دولار من المراكز المكشوفة، ما يعني أن هذا الوقود بعينه صُرف لا خُزّن.
ولا نضع مستوى. فقد تخلّى هذا الموقع عن العتبات الاتجاهية في 3 أغسطس بعد أن رأى شرطين من شروطنا الخاصة يعملان في اتجاهين متعاكسين خلال ثلاثة أيام. حصة الشراء تصف النافذة التي تقيسها. ولا تتنبأ بالتالية، واليوم لم تقس حتى كامل النافذة التي بدا أنها تقيسها.
ولا نعلن استعادة متوسط المئتي يوم كحالة قائمة. فإغلاق واحد فوق مستوى صمد 289 جلسة هو إغلاق واحد. حقيقة تستحق المعرفة وليست اتجاهاً.
وما نقوله أضيق، ونظنه أنفع. في يوم كان مؤشرنا الرئيسي فيه سيقود قارئاً متيقظاً إلى استنتاج معقول لكنه أصغر من الواقع بكثير، جاء التصحيح من قياس ثانٍ على دفتر ثانٍ ومن المراكز المفتوحة. وهذه طريقة عمل لا تنبؤ، ومتاحة لأي شخص لديه الواجهة العامة نفسها.