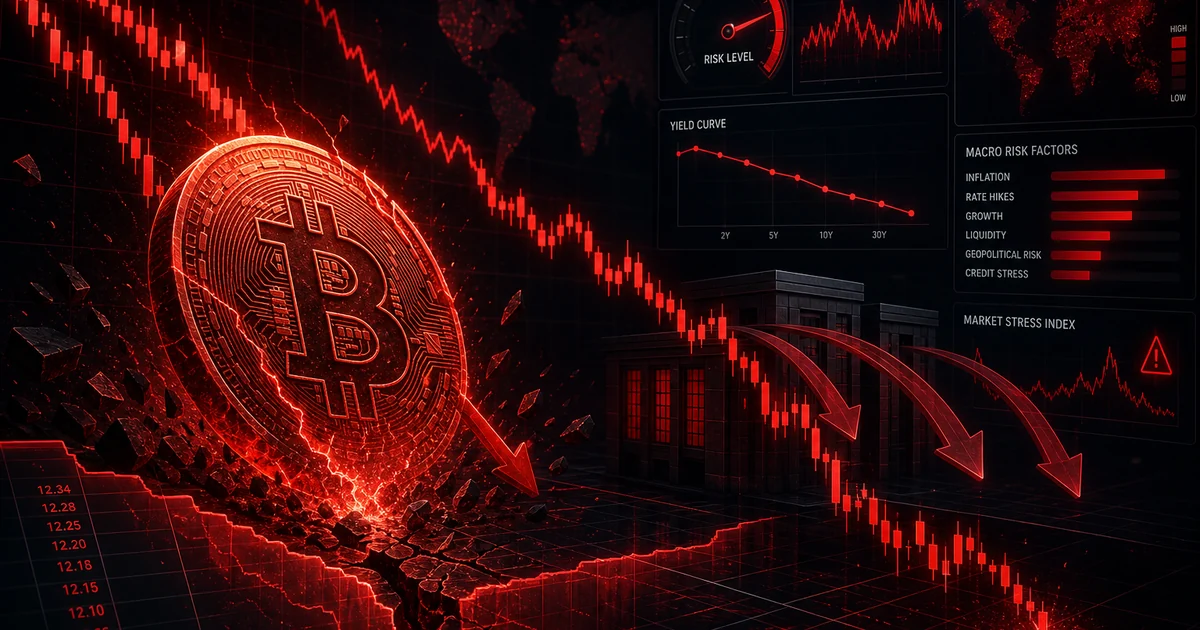
If you opened your portfolio this week and felt your stomach drop, you're not alone. Bitcoin slipped below $61,000 in early June 2026, touching a four-month low near $59,100 and erasing more than half its value from the October 2025 record high of about $126,200. More than half of all Bitcoin in existence is now held at a loss.
The panic is real, and the search bars are full of one question: why is this happening? The honest answer is that no single headline caused it. Five separate forces arrived at roughly the same time and reinforced each other. Here's each one, in plain terms.
1.Record ETF outflows
The single biggest driver is institutional money leaving through the front door. U.S. spot Bitcoin ETFs - the same products that fueled much of the 2024-2025 rally by steadily absorbing supply - went into reverse. Over roughly 10 to 12 consecutive trading sessions in late May and early June, they bled an estimated $2.8 billion to $3.5 billion, with one week alone seeing around $3.4 billion in redemptions. That was the largest single-week outflow since these ETFs launched in early 2024.
This matters mechanically, not just emotionally. When investors redeem ETF shares, the issuer often has to sell the underlying Bitcoin to return cash. Selling begets lower prices, lower prices trigger more redemptions, and the loop feeds itself. It's the exact opposite of the virtuous cycle that drove prices up last year.
2.MicroStrategy broke its own rule
For years, Strategy (formerly MicroStrategy) and its chairman Michael Saylor were the loudest voices of the "never sell" philosophy. So when the company disclosed on June 1 that it had sold 32 BTC at an average of about $77,135 - its first Bitcoin sale since 2022, done to fund preferred-stock dividends - the dollar amount barely mattered. The symbolism did.
The sale was tiny. The signal was enormous. Markets read it as a crack in the most committed holder's resolve.
To be fair to Saylor, the company still holds roughly 843,706 BTC at an average cost near $75,702, and he has framed the sale as a minor treasury operation. But sentiment doesn't deal in nuance during a selloff.
3.A $1.85 billion liquidation cascade
Leverage turned a dip into a plunge. As Bitcoin broke key support, exchanges automatically closed out over-leveraged long positions. In a single 24-hour window, more than $1.85 billion in positions were force-liquidated across the crypto market - one of the largest single-day events of the year, with Bitcoin accounting for the majority.
Each forced sale pushes price lower, which triggers the next batch of liquidations. This is why crashes feel so violent compared to rallies: leverage unwinds far faster than it builds.
4.The AI capital rotation
This one is more structural. A historic wave of capital is being pulled into artificial-intelligence infrastructure - data centers, chips, and a pipeline of blockbuster tech IPOs, including a reported ~$950 billion Anthropic listing drawing enormous attention. Saylor himself argued that capital markets are funding the AI buildout to the tune of roughly $400 billion over six months, and that the ETF outflows reflect a rotation of speculative capital rather than any flaw in Bitcoin itself.
Whether you buy that framing or not, the effect is the same: money that might have flowed into crypto is being routed into AI equities instead.
5.The market is now deeply oversold
Here's the other side of the coin. After a drop this sharp, Bitcoin's 14-day Relative Strength Index (RSI) fell to around 15.31 - a deeply oversold reading. Historically, extreme oversold levels like this have often preceded short-term bounces, simply because selling exhausts itself eventually.
"Oversold" does not mean "guaranteed to bounce." In a strong downtrend, markets can stay oversold longer than traders expect. An RSI of 15 is a reason to pay attention, not a buy signal on its own.
So what should you actually watch now?
When fear is this extreme, the most useful thing isn't another price prediction - it's watching where real money starts flowing back in. Bottoms are rarely called by price alone; they're confirmed by volume. The first sign that smart money is accumulating again is usually a quiet but persistent rise in buying volume, often before the price turns.
This is exactly the kind of shift CryptoFlow is built to catch. Instead of staring at red candles, you can watch which coins are suddenly seeing unusual volume bursts - the early footprint of accumulation. If you're new to the idea, start with our guides on why volume moves before price and how to spot whales before the move.
Watch the market turn in real time
When the bounce comes, volume will move first. CryptoFlow scans five major exchanges every minute and flags unusual activity instantly.
Open the Dashboard →For now, the picture is sobering but not mysterious. A leveraged market met institutional outflows, a symbolic sale, and a powerful competing narrative in AI - all at once. Markets like this punish panic and reward patience. The traders who do well in the next month won't be the ones who guessed the bottom; they'll be the ones who watched the data and waited for confirmation.