The Fear and Greed Index: What It Actually Tells You (and What It Doesn't)

Today's reading: the index sits at 24, deep in Extreme Fear, with the seven-day average at 20. This is the same zone where Bitcoin has historically found bottoms. It is also the zone where prices can keep falling for weeks before anyone feels like buying again. Here is how to read it properly.
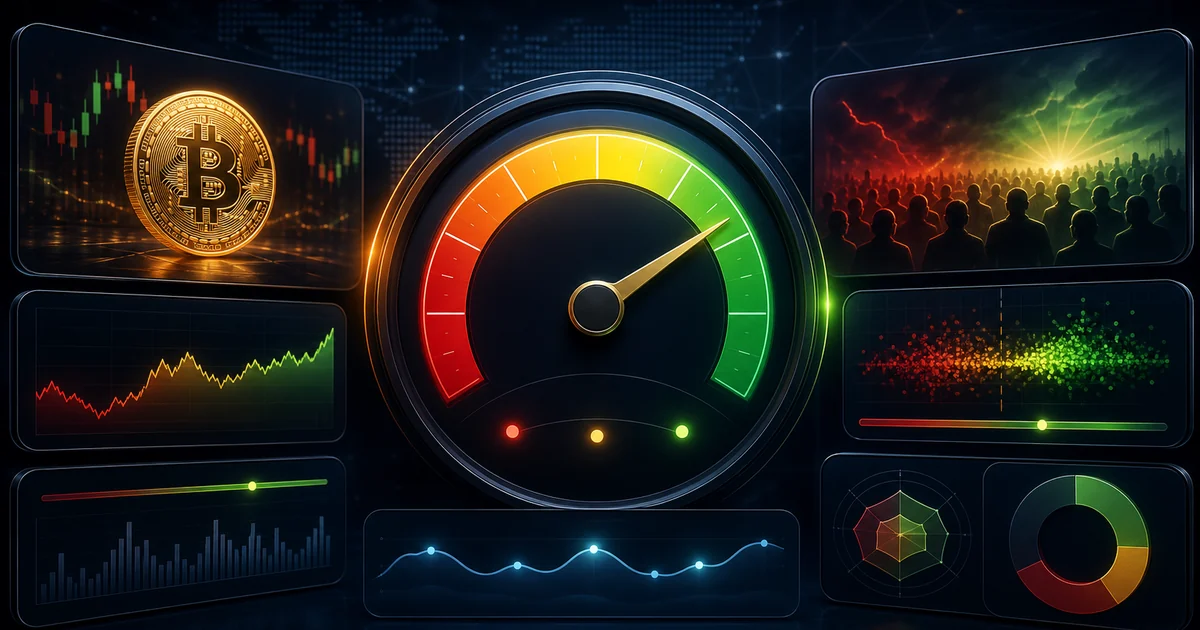
A semicircular gauge showing the Fear and Greed Index from 0 to 100, with zones labeled Extreme Fear, Fear, Neutral, Greed, and Extreme Greed, and the needle pointing to 24 in the Extreme Fear zone
24
today's reading
20
7-day average
0-100
scale (0=max fear)
6
inputs that build it

The Fear and Greed Index is one of the first things people check when they open a crypto site. It is a single number, easy to read, and it feels like it should tell you something useful. Most of the time, it does. But people also misread it constantly, treating Extreme Fear as an automatic buy signal and Extreme Greed as a sell alarm, and then wondering why the trade did not work. Here is what the number actually means, what the six inputs are, and how to fit it into a real decision.

What the index actually is

The Crypto Fear and Greed Index was built by Alternative.me and it publishes a daily score from 0 to 100. Zero is maximum fear, meaning the market is as pessimistic as it gets. One hundred is maximum greed, meaning everyone is euphoric and buying everything. The idea comes from something Warren Buffett said about stocks decades ago: be fearful when others are greedy, and greedy when others are fearful. The index tries to turn that into a number.

The score updates daily and reflects where sentiment sits across a basket of inputs. It is not a price forecast. It does not know where Bitcoin is going. What it does is give you a rough read on the crowd's mood, which can be useful because crowds tend to get the timing wrong at extremes.

The six things it measures

This is where most explanations stop at "it measures sentiment" and move on. But the inputs matter, because knowing what drives the number helps you know when to trust it.

  • Volatility (25%): compares Bitcoin's current volatility to its 30 and 90 day averages. High, unusual volatility reads as fear.
  • Market momentum and volume (25%): compares current trading volume and price momentum to recent averages. Strong buying volume in an up market reads as greed.
  • Social media (15%): scans Twitter and Reddit for crypto-related activity and sentiment. A surge in engagement reads as greed; silence reads as fear.
  • Bitcoin dominance (10%): a rising BTC dominance share reads as fear, since money is retreating to the relative safety of Bitcoin. Falling dominance and rotation into alts reads as greed.
  • Google Trends (10%): tracks search interest for phrases like "Bitcoin price manipulation." Rising paranoid searches are a fear signal.
  • Surveys (15%, currently paused): weekly polls of crypto investors. The team paused these because they felt too easy to game.

Volatility and momentum together make up half the index. That is worth knowing. If Bitcoin just had a violent down move, the index will drop fast regardless of what anyone actually thinks about the market.

How to read the zones

The zones break down like this: 0 to 24 is Extreme Fear, 25 to 49 is Fear, 50 is Neutral, 51 to 74 is Greed, and 75 to 100 is Extreme Greed. And here is the real-world pattern worth understanding.

Extreme Greed tends to cluster around tops. In November 2021, the index hit 84 the week before Bitcoin's all-time high. In March 2024, it hit the 90s during the run to $73,000. And in late 2025, it was deep in Greed territory in the weeks around Bitcoin's peak at $126,000. None of those were sell signals by themselves, but all of them said the same thing: the crowd is fully positioned and any bad news will hurt.

Extreme Fear clusters around bottoms, but the timing is less clean. The index was in Extreme Fear for weeks in mid-2022, a stretch when Bitcoin fell from about $30,000 all the way to $15,500. Being a contrarian buyer at a Fear reading of 25 in June 2022 would have felt brave and turned out very wrong for months.

What it misses

Here is the part that does not get said enough. The index is backward-looking. It tells you how people felt over the recent period, not how they will feel tomorrow. It also cannot factor in macro, which is a big gap right now. The current reading of 24 is partly driven by a tech stock selloff, a strong dollar, and sticky inflation worries, none of which the index explicitly measures. It just sees the result in price and volatility.

The social media component is also noisy. Crypto Twitter tends to get loud in both directions, and it is easy to generate fake engagement. The survey component was paused for exactly this reason. So in practice, the index leans heavily on volatility and momentum, which means it can look very scary right after a big drop even if the actual selling pressure is already done.

And one more: the index is Bitcoin-centric. It reflects BTC sentiment more than the broader altcoin market. When alts are getting crushed but Bitcoin is holding, the index can look calmer than the reality for most altcoin holders.

How to actually use it

The honest way to use it is as a background check, not a trigger. Here is how I think about it.

When the index is in Extreme Greed above 80, it is a flag to tighten risk. Not necessarily to sell everything, but to think twice before adding. The crowd is all-in, leverage is high, and any bad news will flush a lot of longs. When it is in Extreme Fear below 25, it is a flag that the crowd has mostly given up, which historically has been a better time to be looking at entries than when everyone is excited.

But I would not use it alone. The things that actually tell you whether a bottom is forming are on-chain data, real buying volume, whether the liquidation wave looks done, and whether the macro backdrop is improving. The Fear and Greed Index is a secondary confirmation, not the main signal. Think of it as one dial on a dashboard, not the whole dashboard. Which, not coincidentally, is exactly how we use it on ours.

The index is live on the dashboard

CryptoFlow shows today's Fear and Greed reading alongside Bitcoin dominance, the altcoin season index, and live volume signals, so you can read sentiment and flow together instead of switching between tabs.

Open the Dashboard →

What today's reading of 24 means

Deep Extreme Fear. The seven-day average is 20, which is close to the lowest readings of the year. Bitcoin is at $62,500, about 50% below its October 2025 all-time high of $126,000, sitting on the 200-week moving average, which has acted as major support in every previous cycle.

Does that mean it is a buy? Not necessarily. Macro is still hostile: a strong dollar, delayed rate cuts, and an AI stock selloff pulling risk appetite down. The institutional picture is more interesting though. 21shares published their mid-year report today and pointed out that institutions hold 1.25 million Bitcoin near all-time highs in ETP products, and that the current drawdown is far milder than previous cycles' 80-plus percent drops. Holders are not liquidating.

So: extreme fear, real macro headwinds, but also genuine institutional conviction sitting quietly underneath. That is not a simple story, and anyone who gives you a simple answer about what it means is probably selling something.

Frequently asked questions

What is the Crypto Fear and Greed Index?
It is a daily score from 0 to 100 that measures market sentiment in crypto. Below 25 is Extreme Fear, above 75 is Extreme Greed, and everything in between is a spectrum. It combines six inputs including volatility, momentum, social media activity, Bitcoin dominance, and search trends.
Does extreme fear mean I should buy?
Not automatically. Extreme fear signals that the market is pessimistic and sentiment may be oversold, which can make good entry points in hindsight. But the index can stay in fear for weeks or months, and prices can keep falling during that time. It is one signal among several, not a standalone buy trigger.
What does a Fear and Greed score of 24 mean?
A reading of 24 is in the Extreme Fear zone. It means most sentiment inputs are negative or declining. Markets have historically bottomed in this zone, but prices can also overshoot to the downside before recovering.
What are the six inputs of the Fear and Greed Index?
Volatility (25%), market momentum and volume (25%), social media sentiment (15%), Bitcoin dominance (10%), Google Trends (10%), and surveys which are currently paused (15% when active). Volatility and momentum together make up half the index.
What is the difference between the crypto and stock market Fear and Greed Index?
The stock market version by CNN tracks seven inputs including safe haven demand and junk bond spreads. The crypto version by Alternative.me tracks six crypto-specific inputs like Bitcoin dominance and crypto social media. They measure the same broad concept but use completely different data.
This article is for informational and educational purposes only and does not constitute financial advice. All figures cited reflect data available around June 24, 2026 and will change. Always do your own research before making any financial decision.

مؤشر الخوف والطمع: ماذا يخبرك فعلاً، وماذا لا يخبرك

قراءة اليوم: المؤشر عند 24، عميقاً في منطقة "خوف شديد"، ومتوسط 7 أيام عند 20. هذه نفس المنطقة التي وجد فيها البيتكوين قيعانه تاريخياً. وهي أيضاً المنطقة التي يمكن للأسعار فيها أن تستمر في الهبوط لأسابيع قبل أن يشعر أحد بالرغبة في الشراء. هذا كيف تقرأ المؤشر بشكل صحيح.
مقياس نصف دائري يُظهر مؤشر الخوف والطمع من 0 إلى 100، بمناطق تُسمّى خوف شديد وخوف ومحايد وطمع وطمع شديد، مع الإبرة مشيرة إلى 24 في منطقة الخوف الشديد
24
قراءة اليوم
20
متوسط 7 أيام
0-100
المقياس (0=أقصى خوف)
6
مدخلات تبنيه

مؤشر الخوف والطمع هو أول شيء يفتحه كثيرون حين يدخلون أي موقع كريبتو. رقم واحد، سهل القراءة، ويبدو كأنه يجب أن يخبرك بشيء مفيد. وفي الغالب يفعل. لكن الناس تسيء قراءته باستمرار، إذ يتعاملون مع "الخوف الشديد" كإشارة شراء تلقائية ومع "الطمع الشديد" كجرس بيع، ثم يتساءلون لماذا لم تنجح الصفقة. هذا ما يعنيه الرقم فعلاً، وما هي المدخلات الست، وكيف تدمجه في قرار حقيقي.

ما هو المؤشر فعلاً

بناه Alternative.me وينشر درجة يومية من 0 إلى 100. الصفر هو أقصى خوف، أي أن السوق متشائم بأقصى درجاته. والمئة هو أقصى طمع، أي أن الجميع متحمّس ويشتري كل شيء. الفكرة مأخوذة من كلمة شهيرة لوارن بافيت عن الأسهم منذ عقود: كُن خائفاً حين يكون الآخرون طامعين، وطامعاً حين يكون الآخرون خائفين. المؤشر يحاول تحويل ذلك إلى رقم.

يُحدَّث يومياً ويعكس موقع المزاج العام عبر سلة من المدخلات. إنه ليس توقّعاً للسعر. لا يعرف إلى أين سيذهب البيتكوين. ما يفعله هو إعطاؤك قراءة تقريبية لمزاج الجمهور، وهذا قد يكون مفيداً لأن الجمهور يميل للخطأ في التوقيت عند الأطراف.

الست أشياء التي يقيسها

هنا تتوقّف أغلب الشروحات عند "يقيس المزاج" وتمضي. لكن المدخلات مهمة، لأن معرفة ما يحرّك الرقم يساعدك على معرفة متى تثق به.

  • التقلّب (25%): يقارن تقلّب البيتكوين الحالي بمتوسطَيه لـ30 و90 يوماً. التقلّب العالي غير المعتاد يُقرأ كخوف.
  • الزخم وحجم التداول (25%): يقارن حجم التداول الحالي وزخم السعر بالمتوسطات الأخيرة. حجم شراء قوي في سوق صاعد يُقرأ كطمع.
  • وسائل التواصل (15%): يرصد تويتر وريديت لقياس النشاط والمزاج المرتبط بالكريبتو. موجة تفاعل تُقرأ كطمع، والهدوء يُقرأ كخوف.
  • هيمنة البيتكوين (10%): ارتفاع حصة BTC يُقرأ كخوف (المال يتراجع لنسبية أمان البيتكوين)، وهبوطها والدوران للألتس يُقرأ كطمع.
  • Google Trends (10%): يتتبّع الاهتمام بعبارات مثل "تلاعب بسعر البيتكوين". ارتفاع البحث القلق إشارة خوف.
  • الاستطلاعات (15%، موقوفة حالياً): استطلاعات أسبوعية لمستثمري الكريبتو. أوقفها الفريق لأنها كانت سهلة التلاعب.

التقلّب والزخم معاً يشكّلان نصف المؤشر. هذا يستحق المعرفة. إن كان البيتكوين قد هبط للتو بعنف، سينخفض المؤشر بسرعة بغض النظر عمّا يفكّر فيه الناس فعلاً.

كيف تقرأ المناطق

المناطق هكذا: 0 إلى 24 خوف شديد، 25 إلى 49 خوف، 50 محايد، 51 إلى 74 طمع، 75 إلى 100 طمع شديد. والنمط الواقعي الجدير بالفهم هو هذا.

يتجمّع "الطمع الشديد" حول القمم. في نوفمبر 2021 بلغ المؤشر 84 في الأسبوع السابق للذروة التاريخية للبيتكوين. وفي مارس 2024 تجاوز 90 خلال الصعود نحو 73 ألف دولار. وفي أواخر 2025 كان في منطقة طمع عميقة في الأسابيع قرب قمة البيتكوين عند 126 ألف دولار. لم يكن أيٌّ من تلك إشارات بيع بذاتها، لكنها قالت جميعها نفس الشيء: الجمهور في مراكزه بالكامل وأي خبر سيئ سيؤلم.

ويتجمّع "الخوف الشديد" حول القيعان، لكن التوقيت أقل وضوحاً. كان المؤشر في خوف شديد لأسابيع في منتصف 2022، في فترة هبط فيها البيتكوين من نحو 30 ألف دولار إلى 15,500. أن تكون مشترياً معاكساً للتيار عند قراءة خوف 25 في يونيو 2022 كان سيبدو شجاعاً وسيكون خاطئاً جداً لأشهر.

ما الذي يفوته

هنا الجزء الذي لا يُقال كفايةً. المؤشر ينظر للخلف. يخبرك بكيفية شعور الناس في الفترة الأخيرة، لا بكيفية شعورهم غداً. كما لا يستطيع تضمين العوامل الكلية، وهذه فجوة كبيرة الآن. القراءة الحالية 24 مدفوعة جزئياً بانهيار أسهم التكنولوجيا، والدولار القوي، ومخاوف التضخّم المتشبّث، ولا يقيس المؤشر أياً من ذلك صراحةً. إنه يرى فقط النتيجة في السعر والتقلّب.

ومكوّن وسائل التواصل ضجيجي أيضاً. تويتر الكريبتو يصخب في كلا الاتجاهين، ومن السهل توليد تفاعل مصطنع. وقُوِّف مكوّن الاستطلاعات لهذا السبب تحديداً. فعملياً يتّكئ المؤشر بشكل كبير على التقلّب والزخم، ما يعني أنه قد يبدو مرعباً جداً بعد هبوط كبير حتى لو انتهى ضغط البيع الفعلي.

وأمر أخير: المؤشر يمحور حول البيتكوين. يعكس مزاج BTC أكثر من السوق الأوسع للألتكوين. حين تُسحق الألتس لكن البيتكوين يتماسك، قد يبدو المؤشر أكثر هدوءاً من الواقع المعاش لأغلب حاملي الألتس.

كيف تستخدمه فعلاً

الطريقة الصادقة لاستخدامه هي كفحص خلفية، لا كزناد. هذه طريقة تفكيري فيه.

حين يكون في طمع شديد فوق 80، هو علم لتضييق المخاطرة. ليس بالضرورة بيع كل شيء، بل بالتفكير مرتين قبل الإضافة. الجمهور في مراكزه بالكامل، والرافعة مرتفعة، وأي خبر سيئ سيصفّي الكثير من الـ longs. وحين يكون في خوف شديد دون 25، هو علم بأن الجمهور استسلم في أغلبه، وهذا تاريخياً وقت أفضل للبحث عن مداخل من حين يكون الجميع متحمّساً.

لكنني لن أستخدمه وحده. الأشياء التي تخبرك فعلاً بأن قاعاً يتشكّل هي البيانات على السلسلة، وحجم الشراء الحقيقي، وما إذا كانت موجة التصفيات بدت منتهية، وما إذا كان المشهد الكلي يتحسّن. مؤشر الخوف والطمع تأكيد ثانوي، لا الإشارة الرئيسية. فكّر فيه كمقياس واحد على لوحة تحكم، لا اللوحة كاملة. وهو بالمناسبة بالضبط كيف نستخدمه على لوحتنا.

المؤشر مباشر على لوحة التحكم

يعرض CryptoFlow قراءة الخوف والطمع اليومية جنباً إلى جنب مع هيمنة البيتكوين ومؤشر موسم الألت وإشارات الحجم الحي، لتقرأ المزاج والتدفّق معاً بدل التنقّل بين التبويبات.

افتح لوحة التحكم ←

ماذا تعني قراءة 24 اليوم

خوف شديد عميق. متوسط 7 أيام عند 20، قريباً من أدنى قراءات العام. البيتكوين عند 62,500 دولار، نحو 50% أسفل قمته التاريخية في أكتوبر 2025 عند 126,000 دولار، جالساً على المتوسط المتحرّك لـ200 أسبوع الذي كان دعماً رئيسياً في كل دورة سابقة.

هل هذا يعني أنه وقت شراء؟ ليس بالضرورة. الوضع الكلي لا يزال معادياً: دولار قوي، تأخير في خفض الفائدة، وانهيار أسهم الذكاء الاصطناعي يسحب شهية المخاطرة. لكن المشهد المؤسسي أكثر إثارة. نشرت 21shares تقريرها لمنتصف العام اليوم وأشارت إلى أن المؤسسات تحتفظ بـ 1.25 مليون بيتكوين قرب أعلى مستوياتها التاريخية في منتجات ETP، وأن التراجع الحالي أخفّ بكثير من انخفاضات 80% وأكثر في الدورات السابقة. الحاملون لا يبيعون.

إذاً: خوف شديد، ومخاطر كلية حقيقية، لكن أيضاً قناعة مؤسسية حقيقية صامتة في الأسفل. هذه ليست قصة بسيطة، ومن يعطيك إجابة بسيطة عن ماذا تعني فهو على الأرجح يبيع شيئاً.

أسئلة شائعة

ما هو مؤشر الخوف والطمع للكريبتو؟
درجة يومية من 0 إلى 100 تقيس المزاج العام في سوق الكريبتو. دون 25 خوف شديد، فوق 75 طمع شديد، وما بينهما طيف. يجمع ستة مدخلات منها التقلّب والزخم ونشاط وسائل التواصل وهيمنة البيتكوين واتجاهات البحث.
هل يعني الخوف الشديد أنني يجب أن أشتري؟
ليس تلقائياً. يشير الخوف الشديد إلى أن السوق متشائم وقد يكون البيع مبالغاً فيه، وهذا قد يجعل مداخل جيدة بالنظر للخلف. لكن المؤشر قد يبقى في الخوف أسابيع أو أشهراً، والأسعار قد تستمر في الهبوط خلال تلك الفترة. إنه إشارة واحدة بين عدة، لا زناداً مستقلاً للشراء.
ماذا تعني درجة 24 في مؤشر الخوف والطمع؟
قراءة 24 في منطقة الخوف الشديد. تعني أن معظم مدخلات المزاج سلبية أو متراجعة. وجدت الأسواق تاريخياً قيعانها في هذه المنطقة، لكن الأسعار قد تُفرط في الهبوط أيضاً قبل التعافي.
ما هي المدخلات الست لمؤشر الخوف والطمع؟
التقلّب (25%)، والزخم وحجم التداول (25%)، ومزاج وسائل التواصل (15%)، وهيمنة البيتكوين (10%)، وGoogle Trends (10%)، والاستطلاعات الموقوفة حالياً (15% حين تكون نشطة). التقلّب والزخم معاً يشكّلان نصف المؤشر.
ما الفرق بين مؤشر الخوف والطمع للكريبتو وللأسهم؟
نسخة الأسهم من CNN تتتبّع سبعة مدخلات منها الطلب على الملاذات الآمنة وفوارق السندات. نسخة الكريبتو من Alternative.me تتتبّع ستة مدخلات خاصة بالكريبتو كهيمنة البيتكوين ووسائل تواصله. يقيسان نفس المفهوم العام لكن ببيانات مختلفة تماماً.
هذا المقال لأغراض إعلامية وتعليمية فقط ولا يشكّل نصيحة مالية. كل الأرقام المذكورة تعكس بيانات متاحة حول 24 يونيو 2026 وستتغيّر. قم دائماً ببحثك الخاص قبل أي قرار مالي.

These links are included so readers can verify the market data, definitions, and official references behind the article.

أُضيفت هذه الروابط حتى يستطيع القارئ التحقق من بيانات السوق، والتعريفات، والمراجع الرسمية المرتبطة بالمقال.