>

The Fed Meets This Week: Why the Dot Plot Matters More Than the Rate

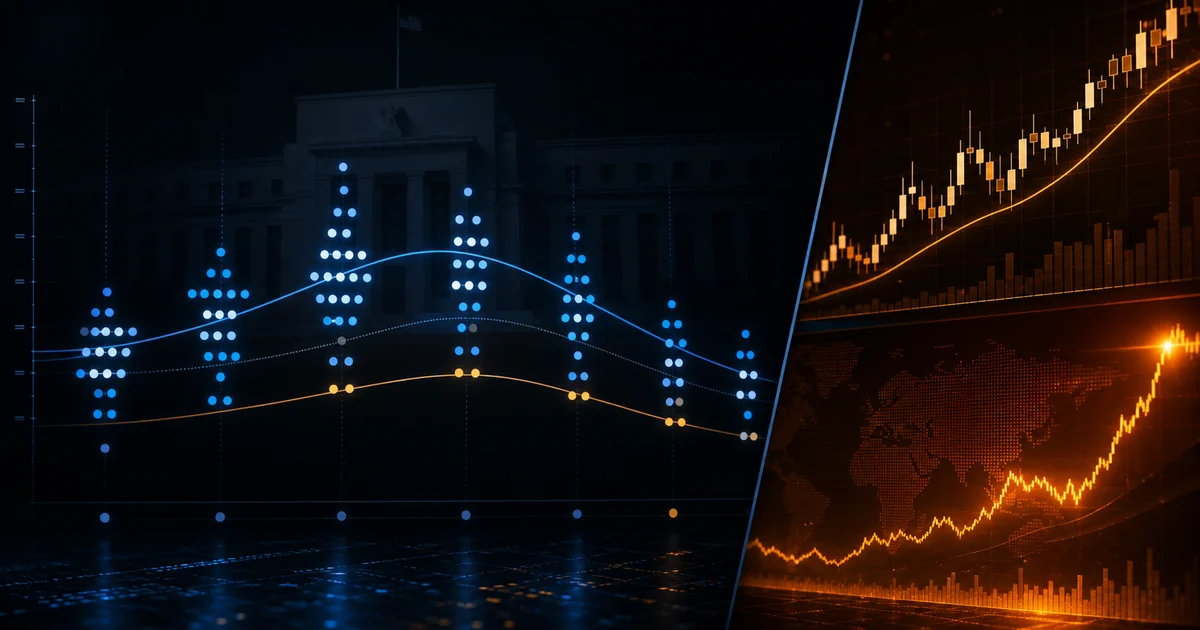
A dot plot grid showing Federal Reserve officials' interest rate projections, with the median dot highlighted as the number markets watch
Jun 16-17
FOMC Meeting
98%
Odds of a Hold
3.50-3.75%
Current Rate
~$63,500
BTC Price

Here is the strange thing about the meeting everyone is waiting for. The Federal Reserve decides rates on Wednesday, and almost nobody expects the rate to change. Futures markets put the odds of a hold at around 98%. The range stays at 3.50% to 3.75%, where it has sat all year. So if the decision is a foregone conclusion, why is the whole market holding its breath?

Because the rate is not the story. The story is a single chart the Fed releases four times a year, and this is one of those four times. Traders call it the dot plot. If you only learn one piece of Fed mechanics, learn this one, because it moves crypto far more often than the rate itself.

What the dot plot actually is

Four times a year the Fed publishes its Summary of Economic Projections. Buried inside is a simple scatter chart. Each of the 19 officials marks one dot for where they think interest rates should sit at the end of this year, next year, and the year after. The dots are anonymous. Nobody knows which dot belongs to which person.

The number everyone reads is the median dot, the one sitting in the middle. It is the closest thing the market gets to the Fed saying out loud where rates are heading. Coming into this meeting, the median dot has pointed to roughly one quarter-point cut for the year, and not much more.

The direction matters even more than today's level. What counts is which way the median moved since the last projection. Analysts at CoinGecko put the read simply in their FOMC explainer: when the dots drift lower than before, the Fed is leaning dovish and rates are heading down, which tends to help risk assets like crypto. When the dots drift higher or stay flat, the Fed is leaning hawkish, which keeps cash and bonds attractive and starves speculative assets of fuel.

The rate decision tells you where the Fed is today. The dot plot tells you where it thinks it is going. Markets care far more about the second answer.

Why this dot plot is different

Two things make Wednesday's projection unusually loaded.

The first is the new chair. Jerome Powell's term ended in mid-May, and Kevin Warsh now runs the Fed after his nomination earlier this year. This is the first projection round on his watch. Markets have years of practice reading Powell's signals. They have almost none reading Warsh. A new chair setting out his first dot plot is a fog the market has to drive through carefully, and fog tends to produce sharp moves in either direction.

The second is the inflation backdrop. May inflation came in at 4.2%, which we covered in the CPI breakdown. That is more than two points above the Fed's 2% target. With prices that sticky and a labor market still holding up, futures traders have shifted toward pricing little easing this year, and some are positioned for the dots to show no cuts at all. If the new projection confirms a higher-for-longer path, that is a headwind for Bitcoin. If it surprises dovish, the relief could be sharp.

One more layer

The Fed is also still running quantitative tightening, slowly pulling money out of the financial system. Even with rates on hold, that drain continues in the background. Any hint from Warsh about speeding it up or winding it down would move markets on its own.

Where crypto sits going in

Bitcoin walks into this meeting in better shape than it was a week ago. It trades near $63,500 after a rough stretch, helped by the Iran de-escalation that drained a lot of fear out of global markets. One of the two big weights on crypto this month has lifted. The Fed is the other, and it has not lifted yet.

There is even a bullish voice in the mix. Standard Chartered told clients this week that it believes the crypto market has already put in its cycle low, pointing to the trough Bitcoin reached during the recent selloff. That view lines up with the 200-week moving average test we wrote about. It is one bank's call, not a guarantee, but it shows the debate is genuinely two-sided right now.

The counterweight is still heavy. Spot Bitcoin ETFs have bled about $4.4 billion across 13 straight sessions, the worst stretch since these funds launched in 2024. If you want to understand why those flows press on price, our explainer on Bitcoin ETF outflows walks through the mechanics.

How Fed day usually plays out

The pattern repeats almost every meeting. The decision drops at 2pm Eastern, the projections and dot plot land at the same time, and the press conference starts half an hour later. The first move is often a head-fake. Price lurches one way on the headline, then reverses hard once the chair starts talking and the market digests the projections. Anyone who traded the knee-jerk gets run over by the real move twenty minutes later.

This is the part most people get wrong. They watch the price candle and react. The candle on Fed day is noise for the first hour. What tells you whether a move has legs is whether real volume is behind it, and that shows up in the flow before it shows up in a clean trend on the chart.

What to actually watch

You do not need to predict the dots. You need a short checklist for when they land:

  1. The median dot versus last time. Lower is dovish and friendly to crypto. Flat or higher is hawkish. This is the single most important number on the page.
  2. How scattered the dots are. Tightly clustered dots mean the Fed agrees. Dots sprayed all over mean disagreement and more uncertainty, which markets dislike.
  3. Warsh's tone in the press conference. The projection is the script. The chair's framing is the delivery, and a new chair's first delivery carries extra weight.
  4. Whether volume confirms the move. A break on rising, sustained volume across exchanges is real. A spike on thin volume usually gets reversed.

That last point is where a volume tool earns its place. When the dot plot hits and price starts jumping, the question is never the first candle. It is whether buyers or sellers are actually showing up in size behind it. That is the difference between a real trend and a trap, and it is exactly what we built CryptoFlow to surface. If volume is new to you, start with why volume moves before price.

Watch Fed day through volume, not just price

CryptoFlow tracks real buying and selling volume across five major exchanges every minute. When the dot plot lands Wednesday, the volume will tell you if the move is real before the chart does.

Open the Dashboard →

The bottom line

The rate almost certainly will not move on Wednesday, and that is fine, because the rate was never the point. The dot plot is. It is the Fed's clearest statement on where money gets more or less expensive from here, it is the first one under a new chair, and it lands with inflation still well above target and crypto still nursing a rough month. Watch the median dot, listen to Warsh, and let the volume tell you whether the reaction is conviction or just noise.

Frequently asked questions

What is the Federal Reserve dot plot?
It is a chart in the Fed's quarterly projections where each of the 19 officials marks one dot for where they expect interest rates to sit. The median dot is the number markets watch most.
Will the Fed change rates at the June 2026 meeting?
Markets put about 98% odds on no change, leaving the range at 3.50% to 3.75%. That is why the decision itself is a non-event and the dot plot is the real focus.
Why does the dot plot matter for crypto?
When the dots drift lower than before, the Fed is leaning dovish and rates are heading down, which tends to help risk assets like crypto. When they stay flat or move higher, the lean is hawkish and pressures them.
This article is for informational and educational purposes only and does not constitute financial advice. Cryptocurrency is highly volatile. Never invest more than you can afford to lose, and always do your own research. Odds, rates, and figures cited reflect reporting around June 13, 2026 and will change.

الفيدرالي يجتمع هذا الأسبوع: لماذا مخطط النقاط أهم من قرار الفائدة

شبكة مخطط النقاط تُظهر توقعات أعضاء الاحتياطي الفيدرالي لأسعار الفائدة، مع إبراز النقطة الوسيطة التي يراقبها السوق
16-17 يونيو
اجتماع FOMC
98%
احتمال التثبيت
3.50-3.75%
الفائدة الحالية
~$63,500
سعر BTC

هناك أمر غريب في الاجتماع الذي ينتظره الجميع. الاحتياطي الفيدرالي يقرر الفائدة يوم الأربعاء، وتقريباً لا أحد يتوقع أن تتغير. أسواق العقود الآجلة تضع احتمال التثبيت عند نحو 98%. النطاق يبقى بين 3.50% و3.75%، حيث ظل طوال العام. فإذا كان القرار محسوماً سلفاً، فلماذا يحبس السوق كله أنفاسه؟

لأن الفائدة ليست القصة. القصة رسم بياني واحد يصدره الفيدرالي أربع مرات في السنة، وهذا الاجتماع واحد من تلك المرات. يسميه المتداولون مخطط النقاط (Dot Plot). إن تعلّمت قطعة واحدة من آليات الفيدرالي، فلتكن هذه، لأنها تحرّك الكريبتو أكثر بكثير من قرار الفائدة نفسه.

ما هو مخطط النقاط فعلاً

أربع مرات سنوياً ينشر الفيدرالي ملخص توقعاته الاقتصادية. بداخله رسم نقاط بسيط. كل عضو من الأعضاء الـ 19 يضع نقطة واحدة عند المستوى الذي يرى أن الفائدة يجب أن تكون عنده نهاية هذا العام، والعام المقبل، والذي يليه. النقاط مجهولة المصدر. لا أحد يعرف أي نقطة تخص أي شخص.

الرقم الذي يقرأه الجميع هو النقطة الوسيطة، تلك الجالسة في المنتصف. إنها أقرب ما يصل إليه السوق من سماع الفيدرالي يقول بصوت عالٍ إلى أين تتجه الفائدة. قبل هذا الاجتماع، أشارت النقطة الوسيطة إلى خفض واحد بمقدار ربع نقطة لهذا العام، وليس أكثر من ذلك بكثير.

والاتجاه يهم أكثر من مستوى اليوم نفسه. المهم هو أي اتجاه تحركت إليه النقطة الوسيطة منذ التوقع السابق. لخّص محللو CoinGecko القراءة ببساطة في شرحهم لاجتماعات الفيدرالي: حين تنزلق النقاط أدنى من قبل، يميل الفيدرالي نحو التيسير والفائدة تتجه للهبوط، وهذا يميل لمساعدة الأصول الخطرة مثل الكريبتو. وحين تنزلق النقاط أعلى أو تبقى ثابتة، يميل الفيدرالي نحو التشدد، وهذا يُبقي النقد والسندات جذابين ويحرم الأصول المضاربية من الوقود.

قرار الفائدة يخبرك أين الفيدرالي اليوم. مخطط النقاط يخبرك إلى أين يظن أنه ذاهب. والسوق يهتم بالإجابة الثانية أكثر بكثير.

لماذا مخطط النقاط هذه المرة مختلف

أمران يجعلان توقعات الأربعاء محمّلة بشكل غير عادي.

الأول هو الرئيس الجديد. انتهت ولاية جيروم باول منتصف مايو، ويدير كيفن وارش الفيدرالي الآن بعد ترشيحه مطلع هذا العام. هذه أول جولة توقعات في عهده. لدى السوق سنوات من الخبرة في قراءة إشارات باول. ولا يكاد يملك خبرة في قراءة وارش. رئيس جديد يضع أول مخطط نقاط له يمثّل ضباباً على السوق أن يقوده بحذر، والضباب يميل لإنتاج تحركات حادة في أي اتجاه.

الثاني هو خلفية التضخم. جاء تضخم مايو عند 4.2%، وهو ما غطيناه في تحليل بيانات التضخم. هذا أعلى من هدف الفيدرالي البالغ 2% بأكثر من نقطتين. ومع أسعار بهذا العناد وسوق عمل لا يزال صامداً، تحوّل متداولو العقود الآجلة نحو تسعير تيسير قليل هذا العام، وبعضهم متموضع لاحتمال ألا تُظهر النقاط أي خفض إطلاقاً. إذا أكّد التوقع الجديد مساراً أعلى لفترة أطول، فذلك ضغط على البيتكوين. وإذا فاجأ بميل تيسيري، فقد يكون الارتياح حاداً.

طبقة إضافية

الفيدرالي لا يزال يطبّق أيضاً التشديد الكمي، ساحباً المال ببطء من النظام المالي. حتى مع تثبيت الفائدة، يستمر هذا السحب في الخلفية. وأي تلميح من وارش بتسريعه أو إنهائه سيحرّك السوق بمفرده.

أين يقف الكريبتو قبل الاجتماع

يدخل البيتكوين هذا الاجتماع في حال أفضل مما كان عليه قبل أسبوع. يتداول قرب 63,500 دولار بعد فترة قاسية، مدعوماً بـتهدئة التوتر مع إيران التي سحبت كثيراً من الخوف من الأسواق العالمية. أحد الثقلين الكبيرين على الكريبتو هذا الشهر ارتفع. والفيدرالي هو الثقل الآخر، وهو لم يرتفع بعد.

بل إن هناك صوتاً صعودياً في المشهد. أبلغ بنك Standard Chartered عملاءه هذا الأسبوع أنه يعتقد أن سوق الكريبتو سجّل قاع دورته بالفعل، مشيراً إلى القاع الذي بلغه البيتكوين خلال موجة البيع الأخيرة. هذا الرأي يتماشى مع اختبار متوسط الـ 200 أسبوع الذي كتبنا عنه. إنه رأي بنك واحد لا ضمانة، لكنه يُظهر أن النقاش ذو وجهين فعلاً الآن.

الثقل المقابل لا يزال كبيراً. نزفت صناديق البيتكوين الفورية نحو 4.4 مليار دولار عبر 13 جلسة متتالية، أسوأ فترة منذ إطلاق هذه الصناديق عام 2024. إذا أردت فهم لماذا تضغط تلك التدفقات على السعر، شرحنا عن خروج الأموال من صناديق ETF يمرّ على الآلية خطوة بخطوة.

كيف يجري يوم الفيدرالي عادةً

النمط يتكرر في كل اجتماع تقريباً. يصدر القرار الساعة الثانية بتوقيت شرق أمريكا، وتصدر التوقعات ومخطط النقاط في الوقت نفسه، ويبدأ المؤتمر الصحفي بعد نصف ساعة. الحركة الأولى غالباً خدعة. يقفز السعر في اتجاه على العنوان، ثم ينعكس بقوة حين يبدأ الرئيس بالكلام ويهضم السوق التوقعات. من يتداول رد الفعل اللحظي يدهسه التحرك الحقيقي بعد عشرين دقيقة.

هذا هو الجزء الذي يخطئ فيه معظم الناس. يراقبون شمعة السعر ويتفاعلون. شمعة يوم الفيدرالي ضوضاء في الساعة الأولى. ما يخبرك إن كان للتحرك أرجل هو ما إذا كان وراءه حجم حقيقي، وذلك يظهر في التدفق قبل أن يظهر كاتجاه واضح على الرسم.

ما الذي تراقبه فعلاً

لا تحتاج للتنبؤ بالنقاط. تحتاج قائمة قصيرة لحظة صدورها:

  1. النقطة الوسيطة مقابل المرة السابقة. الأدنى تيسيري وصديق للكريبتو. والثابت أو الأعلى متشدد. هذا أهم رقم منفرد في الصفحة.
  2. مدى تشتت النقاط. النقاط المتجمّعة بإحكام تعني أن الفيدرالي متفق. والنقاط المبعثرة في كل مكان تعني خلافاً ومزيداً من عدم اليقين، وهو ما يكرهه السوق.
  3. نبرة وارش في المؤتمر الصحفي. التوقع هو النص المكتوب. وتأطير الرئيس هو الأداء، وأول أداء لرئيس جديد يحمل وزناً إضافياً.
  4. هل يؤكّد الحجم التحرك. الكسر على حجم متصاعد ومستدام عبر المنصات حقيقي. والقفزة على حجم ضعيف تنعكس عادةً.

تلك النقطة الأخيرة هي حيث تثبت أداة الحجم قيمتها. حين يصدر مخطط النقاط ويبدأ السعر بالقفز، السؤال ليس أبداً عن الشمعة الأولى. بل عمّا إذا كان المشترون أو البائعون يظهرون فعلاً بحجم كبير وراءها. ذلك هو الفرق بين اتجاه حقيقي وفخّ، وهو بالضبط ما بنينا CryptoFlow لإظهاره. إذا كان الحجم مفهوماً جديداً عليك، ابدأ بـلماذا يتحرك الحجم قبل السعر.

راقب يوم الفيدرالي عبر الحجم، لا السعر وحده

يتتبّع CryptoFlow حجم الشراء والبيع الحقيقي عبر خمس منصات كبرى كل دقيقة. حين يصدر مخطط النقاط الأربعاء، الحجم سيخبرك إن كان التحرك حقيقياً قبل أن يخبرك الرسم.

افتح لوحة التحكم ←

الخلاصة

الفائدة شبه مؤكد أنها لن تتحرك يوم الأربعاء، ولا بأس بذلك، لأن الفائدة لم تكن المقصد أصلاً. المقصد هو مخطط النقاط. إنه أوضح بيان للفيدرالي عن المكان الذي يصبح فيه المال أغلى أو أرخص من هنا، وهو الأول تحت رئيس جديد، ويصدر والتضخم لا يزال أعلى من الهدف بكثير والكريبتو لا يزال يضمّد شهراً قاسياً. راقب النقطة الوسيطة، أنصت إلى وارش، ودع الحجم يخبرك إن كان رد الفعل اقتناعاً أم مجرد ضوضاء.

أسئلة شائعة

ما هو مخطط نقاط الاحتياطي الفيدرالي؟
هو رسم في توقعات الفيدرالي الفصلية حيث يضع كل عضو من الأعضاء الـ 19 نقطة عند المستوى الذي يتوقع أن تكون عنده الفائدة. والنقطة الوسيطة هي الرقم الذي يراقبه السوق أكثر.
هل سيغيّر الفيدرالي الفائدة في اجتماع يونيو 2026؟
تضع الأسواق احتمال 98% بعدم التغيير، مُبقيةً النطاق بين 3.50% و3.75%. لهذا القرار نفسه حدث غير مؤثر، ومخطط النقاط هو التركيز الحقيقي.
لماذا يهم مخطط النقاط للكريبتو؟
حين تنزلق النقاط أدنى من قبل، يميل الفيدرالي للتيسير والفائدة تتجه للهبوط، وهذا يميل لمساعدة الأصول الخطرة كالكريبتو. وحين تبقى ثابتة أو ترتفع، يكون الميل متشدداً ويضغط عليها.
هذا المقال لأغراض إعلامية وتعليمية فقط ولا يشكّل نصيحة مالية. العملات الرقمية شديدة التقلب. لا تستثمر أبداً أكثر مما تتحمّل خسارته، وقم دائماً ببحثك الخاص. الاحتمالات والأسعار والأرقام المذكورة تعكس تقارير حول 13 يونيو 2026 وستتغيّر.

These links are included so readers can verify the market data, definitions, and official references behind the article.

أُضيفت هذه الروابط حتى يستطيع القارئ التحقق من بيانات السوق، والتعريفات، والمراجع الرسمية المرتبطة بالمقال.