What MACD actually measures
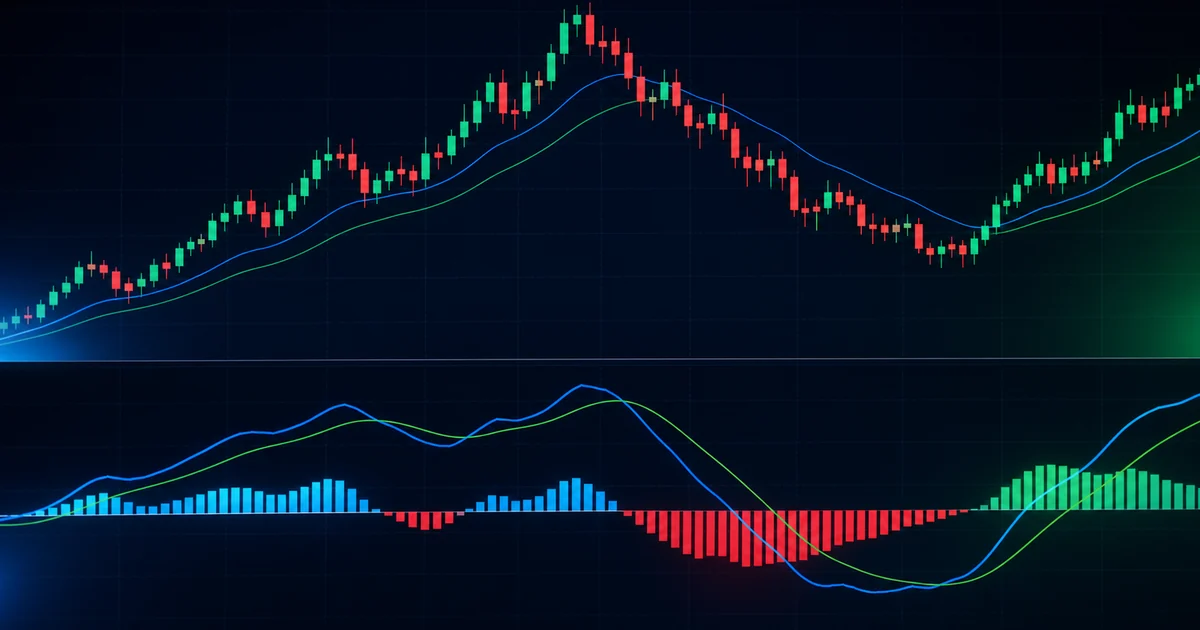
MACD stands for Moving Average Convergence Divergence. The name sounds complicated, but the idea is simple: MACD compares a faster moving average with a slower moving average to show whether momentum is strengthening or weakening.
The standard setting uses the 12-period exponential moving average and the 26-period exponential moving average. The MACD line is the difference between them. Then a 9-period moving average of that MACD line becomes the signal line.
That structure makes MACD a momentum tool, not a magic entry button. It reacts after price has already moved, but it can help traders see whether momentum is expanding, fading, or failing to confirm price.
The three parts traders should read
Many beginners only watch the crossover. That is the weakest way to use MACD. The better approach is to read three layers together.
- MACD line: the difference between the fast and slow EMAs.
- Signal line: a smoother version of the MACD line.
- Histogram: the distance between both lines.
- Buying every bullish crossover.
- Shorting every bearish crossover.
- Reading MACD without trend, volume, and support zones.
How to read MACD crossovers
A bullish crossover happens when the MACD line moves above the signal line. A bearish crossover happens when it falls below it. On paper, that sounds like an easy buy and sell system. In real markets, it is not enough.
The value of a crossover depends on where it happens. A bullish crossover above rising support is different from a bullish crossover inside a choppy range. A bearish crossover after a failed breakout is more meaningful than one that appears after price has already collapsed.
Use the crossover as a momentum change alert. Do not use it as the full trade decision.
How to read the histogram
The histogram is often the best part of MACD because it shows the speed of the momentum shift. When the bars grow above zero, bullish momentum is expanding. When they shrink, bullish momentum is fading. The same logic applies below zero for bearish momentum.
The histogram can turn before the lines cross. That makes it useful as an early warning, but not as a confirmation by itself. A smaller red histogram does not mean the market has turned bullish. It only means bearish pressure is slowing.
MACD divergence
Divergence appears when price and MACD disagree. If price makes a higher high while MACD makes a lower high, upside momentum may be weakening. If price makes a lower low while MACD makes a higher low, downside pressure may be fading.
Divergence is not a guarantee. It is a warning sign. The market can keep trending after divergence appears, especially in strong bull or bear moves. That is why divergence should be paired with structure: trendlines, support, resistance, volume, and invalidation levels.
How to use MACD in crypto
Crypto markets move fast, so MACD can lag during sharp moves and generate noise during sideways periods. The best use is to combine it with a higher-timeframe trend filter. For example, a four-hour bullish crossover is more useful if the daily trend is already improving.
- Use MACD to read momentum, not to predict price alone.
- Give more weight to signals that appear near clear support or resistance.
- Watch the histogram for early slowing in momentum.
- Avoid trading every crossover in a sideways range.
- Always define invalidation before entering a trade.
MACD can help you avoid emotional entries, but it cannot replace risk management.