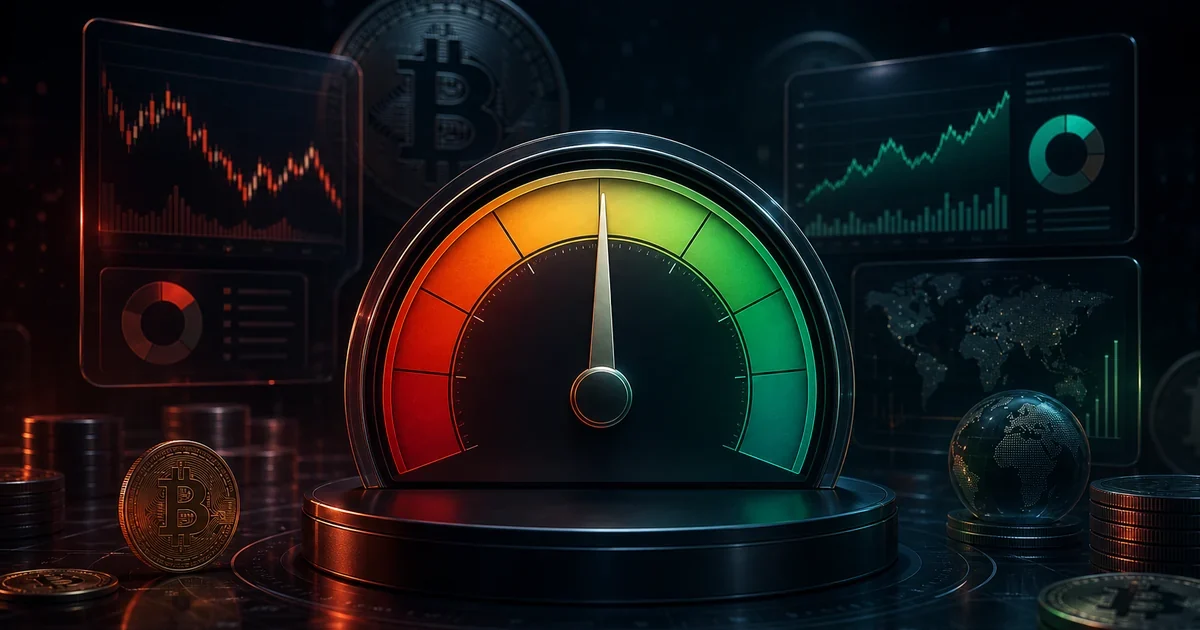
If you've spent any time in crypto, you've seen the small dial - half green, half red, a needle hovering somewhere in between. That's the Crypto Fear & Greed Index, and CryptoFlow displays it at the top of every page for one simple reason: the market's mood often matters as much as its price.
But most people glance at the number and move on. They might know "low number = fear, high number = greed" and that's it. That's a missed opportunity. Used carefully, this index is one of the most reliable contrarian signals in crypto. Used carelessly, it's a great way to lose money. The difference is understanding what's actually inside it.
What the Fear & Greed Index actually is
The Crypto Fear & Greed Index is a daily-updated score between 0 and 100, published by the analytics site alternative.me. The idea is borrowed from CNN's classic Fear & Greed Index for US stocks, but adapted for the crypto market's unique data: volatility, social chatter, dominance shifts, and search trends.
A reading of 0 means the market is in extreme fear. A reading of 100 means extreme greed. Most days fall somewhere in the middle. The score isn't a prediction - it's a thermometer. It tells you how the average crypto participant feels right now, not what the price is about to do.
"Be fearful when others are greedy, and greedy when others are fearful." - Warren Buffett. The index is, in essence, a quantified version of that sentence.
The six components that produce the number
The index is a weighted average of six inputs. Knowing the breakdown helps you read it intelligently, instead of treating the number as a black box.
| Component | Weight | What it measures |
|---|---|---|
| Volatility | 25% | Current BTC volatility vs the 30/90-day average. Sharp drops push the index toward fear. |
| Market Momentum / Volume | 25% | Current trading volume and momentum compared to recent averages. |
| Social Media | 15% | Twitter/X post volume and engagement rates on crypto hashtags. |
| Surveys | 15% | Weekly polls of community sentiment (this input is currently paused). |
| Bitcoin Dominance | 10% | Rising dominance suggests fear (money fleeing alts to BTC); falling dominance hints at greed (risk appetite). |
| Google Trends | 10% | Crypto search interest. Spikes in "bitcoin price prediction" often signal greed; spikes in "bitcoin crash" signal fear. |
The volatility and volume components together carry half the weight - which means the index is rooted in real market data, not just chatter. That's important to know. The "vibes" part is a minority of the calculation.
Reading the five zones
Each zone tells a different story. Here's how experienced traders read them:
- 0-24 (Extreme Fear) - Panic selling, high volatility, social media is doom. Historically, these readings have aligned with major bottoms. Not the right moment to sell. Often the right moment to accumulate slowly.
- 25-49 (Fear) - Caution dominates. The market is digesting losses. Useful for spotting strong coins that hold up while others fall - those are the ones to watch when sentiment recovers.
- 50 (Neutral) - A pause. The market has no strong directional bias. This is often a transition zone, more interesting for what it leads to than what it is.
- 51-74 (Greed) - Optimism is building. Coins are pumping on weak catalysts. Profits are visible. The danger zone for beginners - feels great, ends badly more often than it should.
- 75-100 (Extreme Greed) - Euphoria. "This time is different" appears everywhere. Historically, these readings have aligned with local tops. Not the right moment to buy. Often the right moment to take some profit.
The contrarian thesis (and when it fails)
The classic playbook says: buy extreme fear, sell extreme greed. Backtests on Bitcoin from 2018 to today show this strategy would have outperformed buy-and-hold during multiple cycles, especially the 2018, 2020 and 2022 bottoms.
But contrarian signals are not magic. They fail in two specific situations:
- Macro shocks. When fear is driven by a real systemic event - like an exchange collapse, a regulatory hammer, or a global financial crisis - the index can stay in extreme fear for weeks while prices keep falling. Don't catch falling knives in a structurally broken market.
- Trending bull markets. When BTC is in a strong uptrend, the index can sit in greed or extreme greed for months. Selling every time it hits 75 would have made you exit huge moves early. Trend matters.
The index is a tool for noticing extremes, not for timing entries to the day. Treat it as one input among several, not as a signal to act on by itself.
Combining sentiment with volume signals
This is where the index becomes genuinely powerful. On its own, "the market is fearful" is interesting but vague. Combined with volume data, it becomes actionable.
Two combinations to watch on the CryptoFlow dashboard:
- Extreme Fear (0-24) + heavy ping activity on quality coins. Fear is widespread, yet someone is quietly buying specific names. This is what accumulation looks like. The whale-detection article walks through exactly how to read this pattern.
- Extreme Greed (75+) + ping activity concentrated on small, obscure coins. Late-cycle behavior. Retail is chasing whatever moves. Be the seller, not the buyer.
Mistakes traders make with this indicator
1. Trading the daily change instead of the level
A move from 32 to 38 doesn't mean anything. A move from 32 to 78 over two weeks does. The index is most useful at extremes and at sustained shifts, not at daily wiggles.
2. Confusing this with the CoinMarketCap version
CoinMarketCap has its own Fear & Greed Index with a different formula. The numbers won't match. Pick one source and stay consistent with it, so you're comparing apples to apples over time.
3. Ignoring the trend that produced the reading
A reading of 80 after weeks of bull market is different from a reading of 80 right after a major drop. Context matters. The same number can mean opposite things depending on what came before.
See the live index alongside your signals
The Fear & Greed Index sits at the top of the CryptoFlow dashboard, right next to the volume table - exactly where the two together make the most sense.
Open the Dashboard →Final thought
The Fear & Greed Index won't make you rich on its own. What it will do is force you to pause when the market is screaming euphoria, and look harder when everyone else is hiding. Most of the worst trading decisions humans make are made in those exact two moments. Having a number on the screen that quietly contradicts your emotions is, surprisingly, one of the most valuable tools in trading.
Want to see how the wrong emotions cost real money? The next article in the series covers the five fatal mistakes that beginners keep making - most of them traceable back to ignoring the sentiment around them.