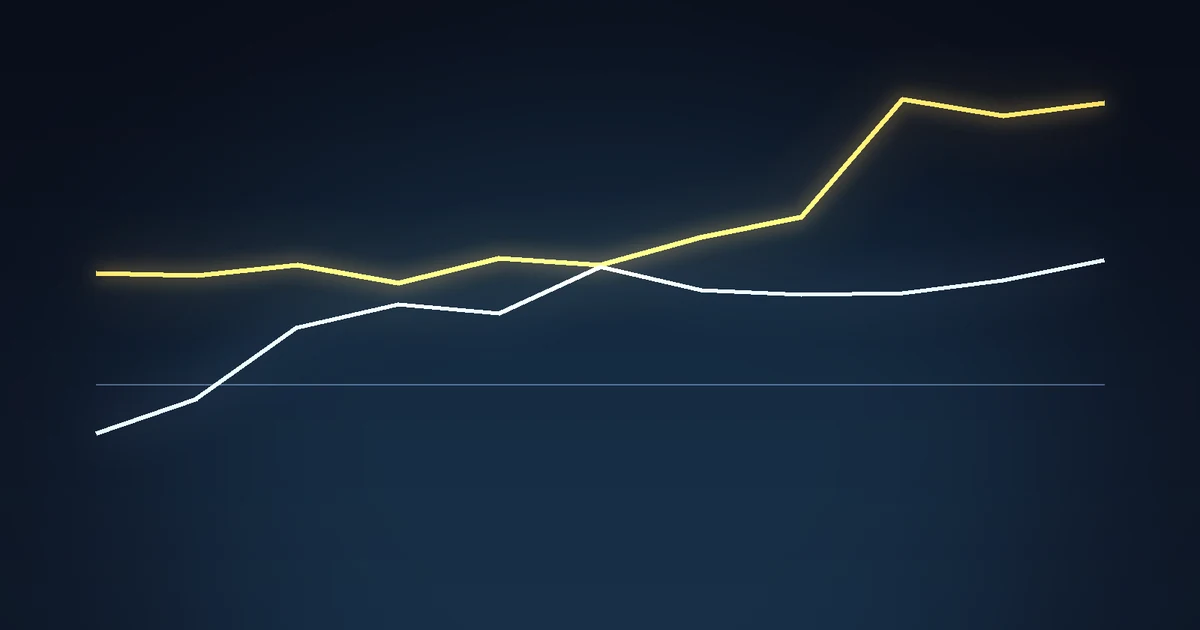
What a real interest rate is
A nominal interest rate is the number on the screen: the 10-year US Treasury yields 4.96%. A real interest rate is what is left after inflation takes its share. If a bond pays 5% and prices rise 3%, your purchasing power grows by about 2%. That 2% is the real rate, and it is the one that decides whether holding cash and bonds actually makes you richer.
The cleanest market measure comes from TIPS, Treasury bonds whose principal is indexed to inflation. Their yield is a real yield directly, set by buyers and sellers every day. The 10-year TIPS yield is published by the Federal Reserve as series DFII10, and it is the number this article uses.
Subtract it from the ordinary 10-year yield and you get the breakeven inflation rate: the inflation the bond market expects over the decade.
| Measure | Latest reading |
|---|---|
| 10-year Treasury yield, nominal | 4.96% |
| 10-year TIPS yield, real | 2.63% |
| 10-year breakeven inflation | about 2.33% |
So investors are being offered about 2.6% a year above inflation, guaranteed by the US government, for ten years. That is the bar every other asset has to clear.
ما سعر الفائدة الحقيقي
سعر الفائدة الاسمي هو الرقم الظاهر على الشاشة: سند الخزانة الأمريكي لعشر سنوات يعطي 4.96%. أما سعر الفائدة الحقيقي فهو ما يتبقى بعد أن يأخذ التضخم حصته. فإن دفع سند 5% وارتفعت الأسعار 3%، تنمو قوتك الشرائية بنحو 2%. وتلك الـ2% هي السعر الحقيقي، وهو الذي يقرر ما إذا كان الاحتفاظ بالنقد والسندات يجعلك أغنى فعلاً.
وأنظف مقياس سوقي له يأتي من سندات TIPS، وهي سندات خزانة مرتبط أصلها بالتضخم. وعائدها عائد حقيقي مباشرةً، يحدده البائعون والمشترون كل يوم. وينشر الاحتياطي الفيدرالي عائد هذه السندات لعشر سنوات تحت الرمز DFII10، وهو الرقم الذي يستخدمه هذا المقال.
واطرحه من العائد العادي لعشر سنوات تحصل على معدل التضخم التعادلي: التضخم الذي تتوقعه سوق السندات خلال العقد.
| المقياس | آخر قراءة |
|---|---|
| عائد الخزانة لعشر سنوات، اسمي | 4.96% |
| عائد سندات TIPS لعشر سنوات، حقيقي | 2.63% |
| التضخم التعادلي لعشر سنوات | نحو 2.33% |
أي أن المستثمرين يُعرض عليهم نحو 2.6% سنوياً فوق التضخم، مضمونة من الحكومة الأمريكية، لعشر سنوات. وهذا هو الحاجز الذي على كل أصل آخر تجاوزه.
The highest since November 2008
On September 16, the day the Federal Reserve raised rates for the first time since 2023, the 10-year real yield closed at 2.68%. The last time it was that high was November 26, 2008, in the middle of the financial crisis.
| Date | 10-year real yield | 10-year nominal |
|---|---|---|
| Dec 31, 2021 | negative 1.04% | 1.52% |
| Oct 19, 2023 | 2.49% | 4.98% |
| Dec 31, 2025 | 1.93% | 4.18% |
| Jun 30, 2026 | 2.20% | 4.44% |
| Sep 16, 2026, Fed hike day | 2.68% | |
| Latest | 2.63% | 4.96% |
Read the first row carefully. At the end of 2021 the real yield was negative: lending to the US government for a decade guaranteed you would lose purchasing power. Since then it has risen by about 3.7 percentage points, one of the fastest swings in the history of the series.
الأعلى منذ نوفمبر 2008
في 16 سبتمبر، اليوم الذي رفع فيه الاحتياطي الفيدرالي الفائدة لأول مرة منذ 2023، أغلق العائد الحقيقي لعشر سنوات عند 2.68%. وآخر مرة كان بهذا الارتفاع كانت 26 نوفمبر 2008، في قلب الأزمة المالية.
| التاريخ | العائد الحقيقي لعشر سنوات | الاسمي لعشر سنوات |
|---|---|---|
| 31 ديسمبر 2021 | سالب 1.04% | 1.52% |
| 19 أكتوبر 2023 | 2.49% | 4.98% |
| 31 ديسمبر 2025 | 1.93% | 4.18% |
| 30 يونيو 2026 | 2.20% | 4.44% |
| 16 سبتمبر 2026، يوم رفع الفيدرالي | 2.68% | |
| آخر قراءة | 2.63% | 4.96% |
اقرأ الصف الأول بعناية. في نهاية 2021 كان العائد الحقيقي سالباً: إقراض الحكومة الأمريكية لعقد يضمن لك خسارة قوتك الشرائية. ومنذها ارتفع نحو 3.7 نقطة مئوية، في واحدة من أسرع التقلبات في تاريخ هذه السلسلة.
What the textbook says should happen
Gold pays nothing. Bitcoin pays nothing. Holding either means giving up the yield you could have earned in a bond, and that sacrifice is called the opportunity cost. When real yields are negative, the cost of holding gold is zero or better, because the bond would have lost you money anyway. When real yields are high, you give up a guaranteed return above inflation to hold a metal.
So the textbook relationship is simple: real yields up, gold down. For most of the 2010s it held remarkably well, and the same logic has been applied to Bitcoin as a non-yielding store of value.
By that logic, a move from negative 1.04% to 2.63% should have been brutal for both. Here is what happened instead.
| Asset | Dec 31, 2021 | Sep 23, 2026 | Change |
|---|---|---|---|
| 10-year real yield | negative 1.04% | 2.63% | up 3.67 points |
| Gold, per ounce, via PAXG | $1,835 | $4,288 | +134% |
| Bitcoin | $46,217 | $84,398 | +83% |
The largest rise in real yields in a generation, and gold more than doubled.
ما يقول الكتاب إنه يجب أن يحدث
الذهب لا يدفع شيئاً. والبيتكوين لا يدفع شيئاً. والاحتفاظ بأي منهما يعني التخلي عن العائد الذي كنت ستجنيه من سند، وتلك التضحية تسمى تكلفة الفرصة البديلة. فحين تكون العوائد الحقيقية سالبة، تكون تكلفة حيازة الذهب صفراً أو أفضل، لأن السند كان سيخسرك المال أصلاً. وحين تكون العوائد الحقيقية مرتفعة، تتخلى عن عائد مضمون فوق التضخم لتحمل معدناً.
فالعلاقة في الكتب بسيطة: العوائد الحقيقية صاعدة، الذهب هابط. وقد صمدت على نحو لافت معظم العقد الثاني من هذا القرن، وطُبّق المنطق نفسه على البيتكوين بوصفه مخزن قيمة لا يدرّ عائداً.
وبهذا المنطق، كان ينبغي أن يكون الانتقال من سالب 1.04% إلى 2.63% قاسياً على كليهما. وهذا ما حدث بدلاً من ذلك.
| الأصل | 31 ديسمبر 2021 | 23 سبتمبر 2026 | التغيّر |
|---|---|---|---|
| العائد الحقيقي لعشر سنوات | سالب 1.04% | 2.63% | صعود 3.67 نقطة |
| الذهب للأونصة، عبر PAXG | $1,835 | $4,288 | +134% |
| البيتكوين | $46,217 | $84,398 | +83% |
أكبر صعود في العوائد الحقيقية منذ جيل، والذهب تضاعف وأكثر.
What five years of weekly data actually show
Levels over five years can hide a lot, so we measured the short-term relationship too. For every week since January 2021, 298 in all, we compared the change in the 10-year real yield with the return on gold and on Bitcoin that same week.
| Asset | Correlation since 2021 | Correlation since 2024 |
|---|---|---|
| Gold | negative 0.22 | negative 0.07 |
| Bitcoin | negative 0.08 | negative 0.07 |
A correlation of negative 1 would mean the textbook holds perfectly; zero means no relationship. Gold still leans the textbook way, but weakly, and the lean has almost vanished since 2024. Bitcoin has barely leaned at all.
The sharpest test is the big weeks. Across the 32 weeks when the real yield rose 15 basis points or more, and the 15 weeks when it fell that much:
| Week type | Gold, mean week | Bitcoin, mean week |
|---|---|---|
| Real yield up 15bp or more, 32 weeks | negative 0.36% | +0.31% |
| Real yield down 15bp or more, 15 weeks | +1.77%, positive 73% of the time | negative 1.10% |
| Everything in between, 251 weeks | +0.30% | +0.69% |
Gold behaves as the textbook predicts in the big weeks, just not by much. Bitcoin does the opposite of the textbook on the big falls in real yields, on a sample of 15 weeks, which is too small to build a theory on and large enough to stop anyone claiming Bitcoin trades as a real-yield instrument.
ما تُظهره بيانات أسبوعية لخمس سنوات فعلاً
المستويات عبر خمس سنوات قد تخفي الكثير، فقسنا العلاقة قصيرة الأجل أيضاً. فلكل أسبوع منذ يناير 2021، أي 298 أسبوعاً، قارنّا تغيّر العائد الحقيقي لعشر سنوات بعائد الذهب والبيتكوين في الأسبوع نفسه.
| الأصل | الارتباط منذ 2021 | الارتباط منذ 2024 |
|---|---|---|
| الذهب | سالب 0.22 | سالب 0.07 |
| البيتكوين | سالب 0.08 | سالب 0.07 |
الارتباط عند سالب 1 يعني أن الكتاب صحيح تماماً؛ والصفر يعني لا علاقة. فالذهب ما زال يميل في اتجاه الكتاب، لكن بضعف، والميل كاد يختفي منذ 2024. والبيتكوين بالكاد مال أصلاً.
والاختبار الأحدّ هو الأسابيع الكبيرة. عبر 32 أسبوعاً صعد فيها العائد الحقيقي 15 نقطة أساس أو أكثر، و15 أسبوعاً هبط فيها بالقدر نفسه:
| نوع الأسبوع | الذهب، الأسبوع الوسطي | البيتكوين، الأسبوع الوسطي |
|---|---|---|
| العائد الحقيقي صاعد 15 نقطة أو أكثر، 32 أسبوعاً | سالب 0.36% | +0.31% |
| العائد الحقيقي هابط 15 نقطة أو أكثر، 15 أسبوعاً | +1.77%، موجب في 73% من المرات | سالب 1.10% |
| كل ما بينهما، 251 أسبوعاً | +0.30% | +0.69% |
فالذهب يتصرف كما يتنبأ الكتاب في الأسابيع الكبيرة، لكن ليس بقدر كبير. أما البيتكوين فيفعل عكس الكتاب عند الهبوط الكبير في العوائد الحقيقية، على عيّنة من 15 أسبوعاً، وهي أصغر من أن تُبنى عليها نظرية، وكبيرة بما يكفي لمنع أي أحد من الادعاء بأن البيتكوين يُتداول أداةً مرتبطة بالعوائد الحقيقية.
Why the textbook broke
Nobody can prove the cause, but three explanations are widely discussed and all three are consistent with the numbers above.
Central banks became the marginal buyer of gold. After Russia's reserves were frozen in 2022, several central banks increased gold holdings for reasons that have nothing to do with the yield on a TIPS bond. A buyer that ignores real yields weakens the relationship.
Fiscal worry replaced inflation worry. High real yields driven by heavy government borrowing are a different signal from high real yields driven by a tight central bank. The first can raise demand for assets outside the financial system at the same time as it raises the yield on bonds.
Bitcoin found new buyers. Spot ETFs, corporate treasuries and a changing regulatory picture drove large flows that had little to do with the opportunity cost of holding it.
The practical lesson is narrower than any of these stories. Real yields are one input, not the lever. They still tell you what a risk-free investment pays above inflation, which matters for every savings and investment decision. They no longer tell you, on their own, what gold or Bitcoin will do next week.
لماذا تعطّل الكتاب
لا أحد يستطيع إثبات السبب، لكن ثلاثة تفسيرات تُناقش على نطاق واسع، وكلها متسقة مع الأرقام أعلاه.
صارت البنوك المركزية المشتري الحدّي للذهب. فبعد تجميد احتياطيات روسيا في 2022، زادت عدة بنوك مركزية حيازاتها من الذهب لأسباب لا علاقة لها بعائد سندات TIPS. ومشترٍ يتجاهل العوائد الحقيقية يُضعف العلاقة.
حلّ القلق المالي محل القلق من التضخم. فالعوائد الحقيقية المرتفعة بسبب اقتراض حكومي ثقيل إشارة مختلفة عن العوائد الحقيقية المرتفعة بسبب بنك مركزي متشدد. والأولى قد ترفع الطلب على الأصول خارج النظام المالي في الوقت نفسه الذي ترفع فيه عائد السندات.
وجد البيتكوين مشترين جدداً. فصناديق ETF الفورية وخزائن الشركات والصورة التنظيمية المتغيرة دفعت تدفقات كبيرة لا علاقة كبيرة لها بتكلفة الفرصة البديلة لحيازته.
والدرس العملي أضيق من أي من هذه القصص. العوائد الحقيقية مُدخل واحد، لا الرافعة. فهي ما زالت تخبرك بما يدفعه استثمار خالٍ من المخاطر فوق التضخم، وهذا يهم كل قرار ادخار واستثمار. لكنها لم تعد تخبرك وحدها بما سيفعله الذهب أو البيتكوين الأسبوع المقبل.
How to use this yourself
Check the real yield, not just the headline rate. A 5% savings rate with 4% inflation is a 1% real return; a 3% rate with 1% inflation is 2%. The second is better, even though it looks worse.
Know where to find it. The Federal Reserve Bank of St. Louis publishes DFII10 free every business day. Breakeven inflation is series T10YIE.
Treat any single-factor story with suspicion. Five years ago "real yields up means gold down" was treated as close to a law. The data above shows why no one variable should carry that much weight, including the ones on this site.
كيف تستخدم هذا بنفسك
افحص العائد الحقيقي، لا السعر الظاهر فقط. فعائد ادخار 5% مع تضخم 4% عائد حقيقي 1%؛ وعائد 3% مع تضخم 1% يعطي 2%. والثاني أفضل، رغم أنه يبدو أسوأ.
اعرف أين تجده. ينشر بنك الاحتياطي الفيدرالي في سانت لويس سلسلة DFII10 مجاناً كل يوم عمل. والتضخم التعادلي هو السلسلة T10YIE.
تعامل بحذر مع أي قصة ذات عامل واحد. فقبل خمس سنوات عومل "العوائد الحقيقية صاعدة يعني الذهب هابط" كأنه شبه قانون. والبيانات أعلاه تبيّن لماذا لا ينبغي لمتغير واحد أن يحمل هذا الوزن كله، بما في ذلك المتغيرات في هذا الموقع.