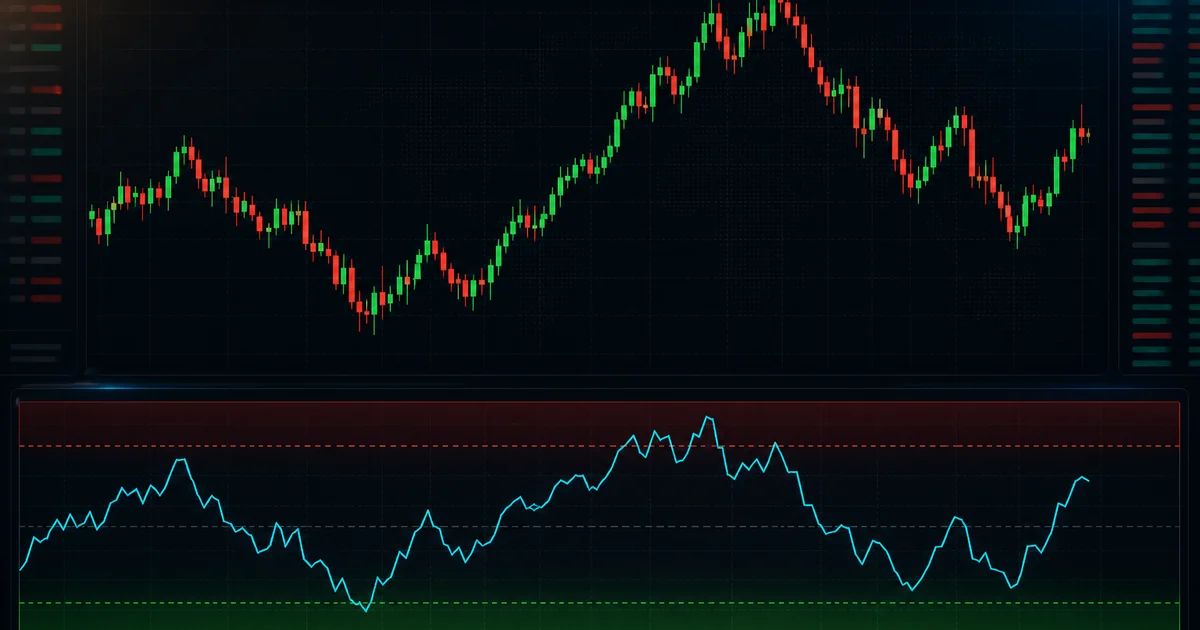
This month, Bitcoin's 14-day RSI fell to roughly 15 - one of the lowest readings in years. Headlines everywhere screamed "deeply oversold." Some traders bought instantly. The price bounced 4%… then rolled over and fell again. If that sequence confused you, you've discovered the single most misunderstood indicator in trading. This guide fixes that.
What RSI actually measures
The Relative Strength Index, developed by J. Welles Wilder in 1978, is a momentum oscillator. It answers one specific question: over the last 14 periods (candles), how strong were the gains compared to the losses?
The mechanics are simple. RSI compares the average size of up-moves to the average size of down-moves over the lookback window, then squeezes the result into a scale from 0 to 100:
- If every recent candle closed higher, RSI approaches 100.
- If every recent candle closed lower, RSI approaches 0.
- If gains and losses are balanced, RSI sits near 50.
That's it. RSI doesn't know about news, whales, support levels, or value. It is a thermometer for recent momentum - nothing more, nothing less. Understanding that limitation is the key to using it well.
The 70/30 zones - and the myth around them
Wilder's classic thresholds are the ones every platform highlights: above 70 the asset is called "overbought," below 30 it's called "oversold." The textbook story says: sell at 70, buy at 30, because the move is stretched and due to reverse.
Here's the uncomfortable truth: that story works reasonably well in sideways, ranging markets - and fails catastrophically in trending markets. In a strong uptrend, RSI can sit above 70 for weeks while price doubles. In a brutal downtrend, RSI can pin below 30 while price keeps grinding lower. Traders who mechanically "bought the oversold" in 2022 watched Bitcoin stay oversold for months on the way from $40,000 to $16,000.
RSI doesn't tell you the move is over. It tells you the move is stretched. Stretched things can keep stretching.
| RSI Reading | What beginners assume | What it actually suggests |
|---|---|---|
| Above 70 | "Sell now, it must drop" | Strong momentum. In an uptrend, often just healthy strength. |
| 50 midline | (usually ignored) | The trend filter pros actually watch - above 50 favors bulls, below favors bears. |
| Below 30 | "Buy now, it must bounce" | Heavy selling pressure. In a downtrend, often just the trend continuing. |
| Below 20 | "Generational buy!" | Exhaustion risk rising - but reversal requires confirmation, not faith. |
Why "oversold" is the most dangerous word in trading
The word itself is the trap. "Oversold" sounds like a verdict - as if the market made an error that must now be corrected. But markets don't owe anyone a correction. What RSI below 30 really documents is that sellers have dominated recently. Sometimes that's exhaustion. Sometimes it's information: holders are exiting for reasons the chart hasn't priced in yet.
The statistics back this up. Extreme oversold readings do precede bounces more often than random - but the bounces are frequently small and brief, and the deepest losses in bear markets happen after the first oversold signal, not before it. Buying purely because RSI printed 25 is not a strategy; it's a coin flip with extra confidence.
How professionals actually use RSI
1. Divergence - the highest-value signal
A bullish divergence forms when price makes a lower low but RSI makes a higher low. Translation: price fell further, but the selling force behind it weakened. The engine is running out of fuel. A bearish divergence is the mirror image at tops - price makes a higher high while RSI makes a lower high. Divergences don't time the exact turn, but they're among the few RSI signals with a genuine track record, especially on higher timeframes (4-hour, daily, weekly).
2. The 50 line as a trend filter
Experienced traders often care more about the 50 midline than the famous extremes. In healthy uptrends, RSI pullbacks tend to bottom around 40-50 and turn back up. In downtrends, rallies tend to stall around 50-60. Where RSI lives relative to 50 quietly tells you which side is in control.
3. Adjusting for regime
In a confirmed trend, pros effectively shift the bands: in an uptrend, 40 becomes the new "oversold" buy zone and 80 the warning level; in a downtrend, 60 becomes the "overbought" fade zone. Using static 70/30 in every market condition is like wearing the same coat in summer and winter.
A live case study: Bitcoin's RSI at 15
This month delivered a textbook lesson in real time. During the June selloff, Bitcoin's daily RSI collapsed to roughly 15.31 - a level rarely seen. The crowd called it a screaming buy. What actually happened: a quick 4% relief bounce off the 200-week average… followed by another slide back toward $60,000 within days, as macro pressure returned.
Both things were true at once: the oversold reading correctly flagged exhaustion risk, and the downtrend correctly kept pressing until something more than an RSI number changed. That "something more" is the subject of the next section.
An indicator derived only from price cannot tell you more than price knows. RSI rearranges the past; it doesn't see the future. Treat every reading as context, never as a command.
The missing half: confirmation by volume
Here's the synthesis that separates RSI users from RSI victims. RSI tells you a move is stretched. It cannot tell you the move is turning. The turn shows up somewhere else first: in volume.
The strongest reversal setups in crypto share the same anatomy: RSI deeply oversold (the rubber band is stretched) plus a visible shift in aggregate buying volume across major exchanges (someone is actually pulling the band back). Oversold RSI with fading volume is a falling knife. Oversold RSI with rising, sustained buy volume - ideally on several exchanges at once - is genuine accumulation, the pattern we broke down in our whale detection guide.
If you only remember one sentence from this article: RSI marks the stretch; volume marks the turn. Our primer on why volume moves before price explains the second half of that equation.
Watch the confirmation side in real time
CryptoFlow tracks live buying and selling volume across five major exchanges - the confirmation layer that turns an RSI reading into an actual signal.
Open the Dashboard →A practical RSI checklist
- Identify the regime first. Trending or ranging? RSI extremes are tradeable in ranges, dangerous against trends.
- Respect the 50 line. It tells you who's in control before you act on any extreme.
- Hunt divergences, not numbers. A higher RSI low against a lower price low beats any single "oversold" print.
- Prefer higher timeframes. Daily and weekly RSI signals carry far more weight than 5-minute noise.
- Demand volume confirmation. No rising buy volume = no entry, no matter how stretched the reading looks.
- Size for being wrong. Even confirmed signals fail. Position sizing and stop-losses are what keep you in the game.
The bottom line
RSI is genuinely useful - as a context tool. It measures how stretched recent momentum is, flags exhaustion risk, and exposes weakening trends through divergence. What it was never designed to do is issue buy and sell orders on its own. Pair it with the regime, the 50 line, and above all with real volume flow, and it becomes part of an edge. Use it alone, and "oversold" will cost you money exactly when it sounds most convincing.