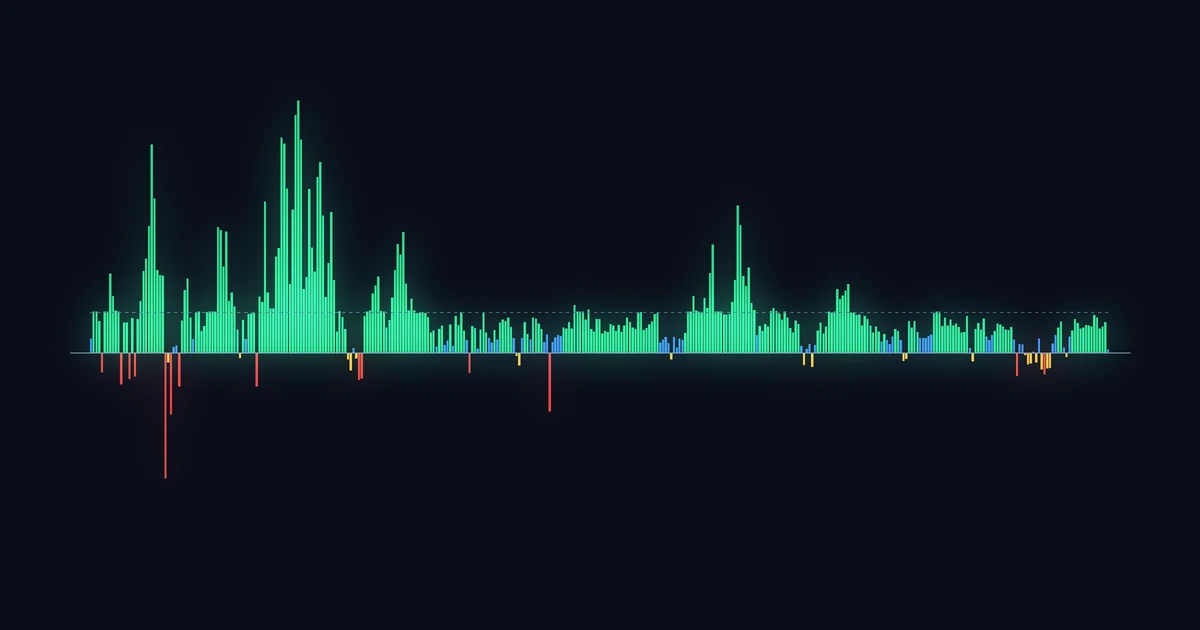
What a funding rate is
Most crypto leverage is traded through perpetual futures, often called perps. An ordinary futures contract has an expiry date, and on that date its price has to meet the spot price. A perpetual never expires, so something else has to stop its price drifting away from the real market. Funding does that job.
The idea came from BitMEX, which launched its perpetual Bitcoin swap in May 2016. Every few hours, traders on one side of the contract pay traders on the other side:
- Positive funding: the perpetual is trading above spot. Longs pay shorts. Holding a long becomes more expensive, holding a short earns a small income, and the price is nudged back down toward spot.
- Negative funding: the perpetual is trading below spot. Shorts pay longs, and the pressure runs the other way.
The exchange does not keep this money. It moves directly between traders. And it is charged on the notional value of the position, meaning its full size, not the margin you posted. With 10x leverage, a 0.01% funding payment costs you 0.1% of your own capital.
ما معدل التمويل
تُتداول معظم الرافعة في العملات الرقمية عبر العقود الآجلة الدائمة، وتُسمى اختصاراً perps. للعقد الآجل العادي تاريخ استحقاق، وفي ذلك التاريخ يجب أن يلتقي سعره بالسعر الفوري. أما العقد الدائم فلا يستحق أبداً، ولذلك لا بد من آلية أخرى تمنع سعره من الابتعاد عن السوق الحقيقية. وهذه هي وظيفة التمويل.
جاءت الفكرة من BitMEX التي أطلقت عقد المبادلة الدائم على البيتكوين في مايو 2016. فكل بضع ساعات يدفع المتداولون في جانب من العقد للمتداولين في الجانب الآخر:
- تمويل موجب: العقد الدائم يُتداول فوق السعر الفوري. أصحاب مراكز الشراء يدفعون لأصحاب مراكز البيع. فيصبح الاحتفاظ بمركز شراء أغلى، ويدرّ مركز البيع دخلاً صغيراً، ويُدفع السعر برفق نحو السعر الفوري.
- تمويل سالب: العقد الدائم يُتداول تحت السعر الفوري. أصحاب مراكز البيع يدفعون لأصحاب مراكز الشراء، ويعمل الضغط في الاتجاه المعاكس.
ولا تحتفظ المنصة بهذا المال، بل ينتقل مباشرة بين المتداولين. ويُحتسب على القيمة الاسمية للمركز، أي حجمه الكامل، لا على الهامش الذي أودعته. فمع رافعة 10 أضعاف، تكلّفك دفعة تمويل بنسبة 0.01% ما يعادل 0.1% من رأس مالك الفعلي.
How Binance calculates it, and why 0.01% keeps appearing
Binance settles Bitcoin funding every eight hours, at 00:00, 08:00 and 16:00 UTC. Its published formula has two parts:
The premium index measures how far the perpetual trades from the spot price index, averaged over the eight hours. The interest rate is fixed by Binance at 0.03% a day, which is 0.01% per eight-hour interval. The clamp limits how far the second term can move.
Work through the arithmetic and a useful rule falls out. Whenever the average premium sits between about -0.04% and +0.06%, the two premium terms cancel and funding settles at exactly 0.0100%. That is why the same number appears so often. It is the default for a market in balance, and it is slightly positive by design, because the formula assumes borrowing dollars costs more than borrowing Bitcoin.
So read Binance funding against 0.01%, not against zero. Above 0.01% means the perpetual traded at a real premium and longs were paying up. Between zero and 0.01% means it traded at a small discount. Below zero means the discount was deep enough that shorts paid.
What it costs, for a position that stays the same size:
| Funding per 8 hours | $10,000 long pays per day | Per year, if unchanged |
|---|---|---|
| 0.0050% | $1.50 | about $548 |
| 0.0100%, the default | $3.00 | about $1,095 |
| 0.0500% | $15.00 | about $5,475 |
| 0.1000% | $30.00 | about $10,950 |
For a short, flip the signs: the same numbers are income. The current cap for Bitcoin on Binance, from its public funding info endpoint, is plus or minus 0.30% per interval.
كيف تحسبه Binance، ولماذا يتكرر الرقم 0.01%
تُسوّي Binance تمويل البيتكوين كل ثماني ساعات، عند الساعة 00:00 و08:00 و16:00 بتوقيت UTC. وللمعادلة المنشورة جزآن:
مؤشر العلاوة يقيس مدى ابتعاد سعر العقد الدائم عن مؤشر السعر الفوري، في المتوسط خلال الساعات الثماني. أما سعر الفائدة فتثبّته Binance عند 0.03% يومياً، أي 0.01% لكل فترة من ثماني ساعات. ودالة clamp تحدّ من مدى تحرك الحد الثاني.
وإن أجريت الحساب تخرج قاعدة مفيدة. كلما كان متوسط العلاوة بين نحو -0.04% و+0.06%، يلغي حدّا العلاوة أحدهما الآخر ويُسوّى التمويل عند 0.0100% بالضبط. ولهذا يتكرر الرقم نفسه كثيراً. فهو القيمة الافتراضية لسوق متوازنة، وهو موجب قليلاً عن قصد، لأن المعادلة تفترض أن اقتراض الدولار أغلى من اقتراض البيتكوين.
لذلك اقرأ تمويل Binance مقارنةً بـ0.01%، لا بالصفر. فما فوق 0.01% يعني أن العقد الدائم تداول بعلاوة حقيقية وأن المشترين دفعوا ثمنها. وما بين الصفر و0.01% يعني أنه تداول بخصم صغير. وما دون الصفر يعني أن الخصم كان عميقاً بما يكفي ليدفع البائعون.
وهذه التكلفة لمركز يبقى حجمه ثابتاً:
| التمويل لكل 8 ساعات | ما يدفعه مركز شراء بـ$10,000 يومياً | سنوياً، إن لم يتغير |
|---|---|---|
| 0.0050% | $1.50 | نحو $548 |
| 0.0100%، القيمة الافتراضية | $3.00 | نحو $1,095 |
| 0.0500% | $15.00 | نحو $5,475 |
| 0.1000% | $30.00 | نحو $10,950 |
أما لمركز البيع فاقلب الإشارات: الأرقام نفسها تصبح دخلاً. والحد الأقصى الحالي للبيتكوين في Binance، بحسب واجهة معلومات التمويل العامة لديها، هو زائد أو ناقص 0.30% لكل فترة.
Seven years of Bitcoin funding, measured
We downloaded every funding settlement for Binance's BTCUSDT perpetual from its first on September 10, 2019, to 16:00 UTC on September 24, 2026: 7,715 settlements. The table adds up each calendar year. The second column is what a $10,000 long held all year at constant size would have paid, before trading fees.
| Year | Funding paid by a $10,000 long | Settlements above 0.01% | Settlements below zero |
|---|---|---|---|
| 2020 | $1,724 | 294 of 1,098 | 14.3% |
| 2021 | $3,061 | 470 of 1,095 | 7.3% |
| 2022 | $416 | 0 | 22.1% |
| 2023 | $787 | 69 | 10.1% |
| 2024 | $1,196 | 213 | 8.4% |
| 2025 | $513 | 0 | 12.9% |
| 2026, to Sep 24 | $215 | 0 | 26.1% |
Two things stand out. The cost of holding leverage has collapsed: 2021 was the year of 10x retail longs, and the rate topped 0.10% per interval 74 times, on 43 different days. And the share of negative settlements in 2026 is the highest of any full or partial year in the data.
Across the whole history the average settlement was 0.0106%, very close to the default, and 35.2% of all settlements were exactly 0.0100%. Ethereum's perpetual tells the same story: its longs paid 37.5% of notional in 2021 and 1.35% so far in 2026.
سبع سنوات من تمويل البيتكوين، مقيسة
نزّلنا كل تسوية تمويل لعقد BTCUSDT الدائم في Binance منذ أولها في 10 سبتمبر 2019 حتى الساعة 16:00 بتوقيت UTC في 24 سبتمبر 2026: 7,715 تسوية. ويجمع الجدول كل سنة ميلادية. والعمود الثاني هو ما كان سيدفعه مركز شراء بقيمة $10,000 محتفظ به طوال العام بحجم ثابت، قبل رسوم التداول.
| السنة | التمويل المدفوع من مركز شراء بـ$10,000 | تسويات فوق 0.01% | تسويات تحت الصفر |
|---|---|---|---|
| 2020 | $1,724 | 294 من 1,098 | 14.3% |
| 2021 | $3,061 | 470 من 1,095 | 7.3% |
| 2022 | $416 | 0 | 22.1% |
| 2023 | $787 | 69 | 10.1% |
| 2024 | $1,196 | 213 | 8.4% |
| 2025 | $513 | 0 | 12.9% |
| 2026، حتى 24 سبتمبر | $215 | 0 | 26.1% |
أمران يبرزان. الأول أن تكلفة الاحتفاظ بالرافعة انهارت: فقد كان 2021 عام مراكز الشراء الصغيرة برافعة 10 أضعاف، وتجاوز المعدل 0.10% لكل فترة 74 مرة، في 43 يوماً مختلفاً. والثاني أن نسبة التسويات السالبة في 2026 هي الأعلى بين كل السنوات، كاملةً أو جزئية، في البيانات.
وعبر التاريخ كله كان متوسط التسوية 0.0106%، قريباً جداً من القيمة الافتراضية، وكانت 35.2% من كل التسويات 0.0100% بالضبط. وعقد الإيثريوم الدائم يروي القصة نفسها: دفع أصحاب مراكز الشراء فيه 37.5% من القيمة الاسمية في 2021، و1.35% حتى الآن في 2026.
1,962 settlements without going above the default
The last time Binance Bitcoin funding settled above 0.01% was 0.0111% at 16:00 UTC on December 9, 2024. Since then there have been 1,962 settlements, about 21 and a half months, and none of them went higher. In rule terms: for 21 months, the perpetual has not once traded at an average premium of more than roughly 0.06% over spot through a full eight-hour window.
That stretch includes Bitcoin's all-time high. Binance's perpetual reached $126,208 on October 6, 2025. Compare the funding around that top with the run-up to the 2021 peak:
| Window | Average settlement | Highest settlement |
|---|---|---|
| Mar 1 to Apr 14, 2021 | 0.0465% | 0.1486% |
| Oct 1 to Oct 7, 2025, the record high | 0.0085% | 0.0100% |
| Last 30 days to Sep 24, 2026 | 0.0062% | 0.0100% |
At the 2025 record, longs were paying less than the default. Four and a half years earlier they paid five times as much on average, with individual readings fifteen times higher.
We have seen this matter before. On August 21 several outlets reported Bitcoin funding at a "20 month high" and treated it as a warning sign. On Binance that reading was exactly 0.0100%, the default. When a 20-month high equals the resting value, what it mostly tells you is how quiet the series has been.
1,962 تسوية دون تجاوز القيمة الافتراضية
آخر مرة سُوّي فيها تمويل البيتكوين في Binance فوق 0.01% كانت 0.0111% عند الساعة 16:00 بتوقيت UTC في 9 ديسمبر 2024. ومنذ ذلك الحين جرت 1,962 تسوية، أي نحو واحد وعشرين شهراً ونصف، ولم تتجاوزها أي منها. وبلغة القاعدة: طوال 21 شهراً لم يتداول العقد الدائم ولو مرة بعلاوة متوسطة تزيد على نحو 0.06% فوق السعر الفوري خلال فترة كاملة من ثماني ساعات.
وتشمل هذه الفترة أعلى مستوى في تاريخ البيتكوين. فقد بلغ عقد Binance الدائم $126,208 في 6 أكتوبر 2025. قارن التمويل حول تلك القمة بالصعود نحو قمة 2021:
| الفترة | متوسط التسوية | أعلى تسوية |
|---|---|---|
| من 1 مارس إلى 14 أبريل 2021 | 0.0465% | 0.1486% |
| من 1 إلى 7 أكتوبر 2025، القمة التاريخية | 0.0085% | 0.0100% |
| آخر 30 يوماً حتى 24 سبتمبر 2026 | 0.0062% | 0.0100% |
عند قمة 2025 كان المشترون يدفعون أقل من القيمة الافتراضية. وقبل ذلك بأربع سنوات ونصف دفعوا خمسة أضعاف ذلك في المتوسط، مع قراءات منفردة أعلى بخمسة عشر ضعفاً.
وقد رأينا أهمية ذلك من قبل. ففي 21 أغسطس نقلت عدة منصات إخبارية أن تمويل البيتكوين في "أعلى مستوى منذ 20 شهراً" وعاملته كإشارة تحذير. وفي Binance كانت تلك القراءة 0.0100% بالضبط، أي القيمة الافتراضية. وحين يساوي أعلى مستوى في 20 شهراً قيمة السكون، فإن أكثر ما يخبرك به هو مدى هدوء السلسلة.
When shorts paid: February to April 2026
The other side of the story is negative funding. Since 2019 only three calendar months had a negative average on Binance Bitcoin funding before this year: March 2020 (the pandemic crash), July 2021 and November 2022 (the FTX collapse). None of them came back to back.
In 2026 it happened three months running:
| Month | Average funding, annualised | Negative settlements | Bitcoin, month-end close |
|---|---|---|---|
| February 2026 | -0.83% | 45 of 84 | $66,937 |
| March 2026 | -1.09% | 52 of 93 | $68,242 |
| April 2026 | -2.16% | 58 of 90 | $76,305 |
| May 2026 | +2.72% | 27 of 93 | $73,653 |
Bitcoin rose about 14% from the end of February to the end of April, and funding became more negative as it rose. If negative funding simply meant traders were betting on a fall, that is the opposite of what you would expect.
CoinDesk reported one explanation at the time. 10x Research said the 30-day average funding rate had reached minus 5% against a historical norm of plus 8%, measured across its own set of venues, and argued the cause was structural hedging rather than bearish conviction: funds shorting perpetuals to neutralise Bitcoin they held elsewhere. We cannot verify who was shorting. What our data does show is that the discount persisted through a rising market, which fits a hedging story better than a panic story.
حين دفع البائعون: من فبراير إلى أبريل 2026
الوجه الآخر للقصة هو التمويل السالب. فمنذ 2019 لم يكن متوسط تمويل البيتكوين في Binance سالباً قبل هذا العام إلا في ثلاثة أشهر ميلادية: مارس 2020 (انهيار الجائحة)، ويوليو 2021، ونوفمبر 2022 (انهيار FTX). ولم يأتِ أي منها متتالياً.
وفي 2026 حدث ذلك ثلاثة أشهر متتالية:
| الشهر | متوسط التمويل، على أساس سنوي | التسويات السالبة | البيتكوين، إغلاق نهاية الشهر |
|---|---|---|---|
| فبراير 2026 | -0.83% | 45 من 84 | $66,937 |
| مارس 2026 | -1.09% | 52 من 93 | $68,242 |
| أبريل 2026 | -2.16% | 58 من 90 | $76,305 |
| مايو 2026 | +2.72% | 27 من 93 | $73,653 |
صعد البيتكوين نحو 14% من نهاية فبراير إلى نهاية أبريل، وازداد التمويل سلبيةً مع صعوده. ولو كان التمويل السالب يعني ببساطة أن المتداولين يراهنون على الهبوط، لكان هذا عكس المتوقع.
ونقلت CoinDesk تفسيراً في حينه. فقد قالت 10x Research إن متوسط معدل التمويل لثلاثين يوماً بلغ سالب 5% مقابل معدل تاريخي معتاد عند موجب 8%، مقيساً عبر مجموعة المنصات التي تتابعها، ورأت أن السبب تحوّط هيكلي لا قناعة هبوطية: صناديق تبيع العقود الدائمة على المكشوف لتحييد بيتكوين تحتفظ به في مكان آخر. ولا نستطيع التحقق ممن كان يبيع. لكن ما تُظهره بياناتنا هو أن الخصم استمر خلال سوق صاعدة، وهذا أقرب إلى قصة تحوّط منه إلى قصة ذعر.
Does extreme funding predict the next move?
The folklore says very high funding marks a top and deeply negative funding marks a bottom. We tested it on 2,542 days of Binance data, adding up each day's three settlements and comparing that with Bitcoin's price change over the following 30 days.
| Days | Median next 30 days | Higher after 30 days |
|---|---|---|
| All 2,542 days | +1.8% | 55% |
| Highest 5% of funding, 128 days | 0.0% | 50% |
| Lowest 5% of funding, 127 days | +9.1% | 72% |
The low-funding row looks impressive, and it deserves suspicion. Those 127 days are bunched into a handful of episodes, 37 of them in 2020 around the pandemic crash and 28 in 2022, so the real sample is closer to a dozen events than to 127 independent trials. The high-funding days are even more concentrated: 75 of the 128 fall in 2021.
The broader measure is flat. The correlation between a day's funding and the next 30 days' return is negative 0.06, which is close to no relationship at all. The correlation between the past 30 days' funding and the past 30 days' price change is 0.34. Funding mostly describes what the price has already done.
هل يتنبأ التمويل المتطرف بالحركة التالية؟
تقول الحكمة الشائعة إن التمويل المرتفع جداً يسبق القمم، وإن التمويل السالب بعمق يسبق القيعان. اختبرنا ذلك على 2,542 يوماً من بيانات Binance، فجمعنا التسويات الثلاث لكل يوم وقارنّاها بتغير سعر البيتكوين خلال الثلاثين يوماً التالية.
| الأيام | الوسيط في الثلاثين يوماً التالية | أعلى بعد 30 يوماً |
|---|---|---|
| كل الأيام، 2,542 يوماً | +1.8% | 55% |
| أعلى 5% تمويلاً، 128 يوماً | 0.0% | 50% |
| أدنى 5% تمويلاً، 127 يوماً | +9.1% | 72% |
يبدو صف التمويل المنخفض لافتاً، ويستحق الشك. فهذه الأيام الـ127 متكتلة في عدد قليل من النوبات، 37 منها في 2020 حول انهيار الجائحة و28 في 2022، فالعيّنة الفعلية أقرب إلى دزينة من الأحداث منها إلى 127 تجربة مستقلة. وأيام التمويل المرتفع أشد تركزاً: 75 من أصل 128 تقع في 2021.
أما المقياس الأشمل فمسطّح. فالارتباط بين تمويل يوم ما وعائد الثلاثين يوماً التالية سالب 0.06، وهو قريب من انعدام العلاقة. والارتباط بين تمويل الثلاثين يوماً الماضية وتغير السعر في الثلاثين يوماً الماضية 0.34. فالتمويل يصف في الغالب ما فعله السعر بالفعل.
How to read funding yourself
Know your baseline. On Binance and most exchanges that copied its formula, 0.01% per eight hours is neutral. A reading of 0.01% is not a sign of leverage, and a headline that calls it a high has usually picked a short window.
Count the cost before you open the trade. Multiply notional by the rate by the number of settlements you expect to hold through. At the default, a leveraged long held for a month pays about 0.9% of notional. At 10x that is 9% of your margin, before a single price move.
Check the interval. Bitcoin settles every eight hours on Binance, but some smaller contracts settle every four hours or even every hour. The same displayed rate then costs two or eight times as much per day.
Treat negative funding as a question. It can mean crowded shorts, or it can mean hedgers who are not betting on direction at all. The price action alongside it, and flows elsewhere, tell you which. Our guide to liquidations covers what happens when a crowded side is forced out, and the taker buy share guide explains a spot-market measure that is harder for hedgers to move.
كيف تقرأ التمويل بنفسك
اعرف خط الأساس. في Binance ومعظم المنصات التي نسخت معادلتها، يمثّل 0.01% لكل ثماني ساعات حالة الحياد. فقراءة 0.01% ليست علامة على رافعة مفرطة، والعنوان الذي يصفها بأنها مرتفعة اختار في العادة نافذة زمنية قصيرة.
احسب التكلفة قبل فتح الصفقة. اضرب القيمة الاسمية في المعدل في عدد التسويات التي تتوقع أن تبقى خلالها. فعند القيمة الافتراضية يدفع مركز شراء برافعة محتفظ به شهراً نحو 0.9% من القيمة الاسمية. ومع رافعة 10 أضعاف يعادل ذلك 9% من هامشك، قبل أي حركة في السعر.
تحقق من الفترة. يُسوّى البيتكوين كل ثماني ساعات في Binance، لكن بعض العقود الأصغر تُسوّى كل أربع ساعات أو حتى كل ساعة. وحينها يكلّف المعدل المعروض نفسه ضعفين أو ثمانية أضعاف يومياً.
تعامل مع التمويل السالب كسؤال. فقد يعني مراكز بيع مزدحمة، وقد يعني متحوّطين لا يراهنون على الاتجاه أصلاً. وحركة السعر المصاحبة له، والتدفقات في أماكن أخرى، تخبرك أيهما. ويغطي دليلنا عن التصفيات ما يحدث حين يُجبر جانب مزدحم على الخروج، ويشرح دليل نسبة الشراء النشط مقياساً من السوق الفورية يصعب على المتحوّطين تحريكه.