Bitcoin Reclaims $66,000: What's Behind the Bounce, and the Test Still Ahead

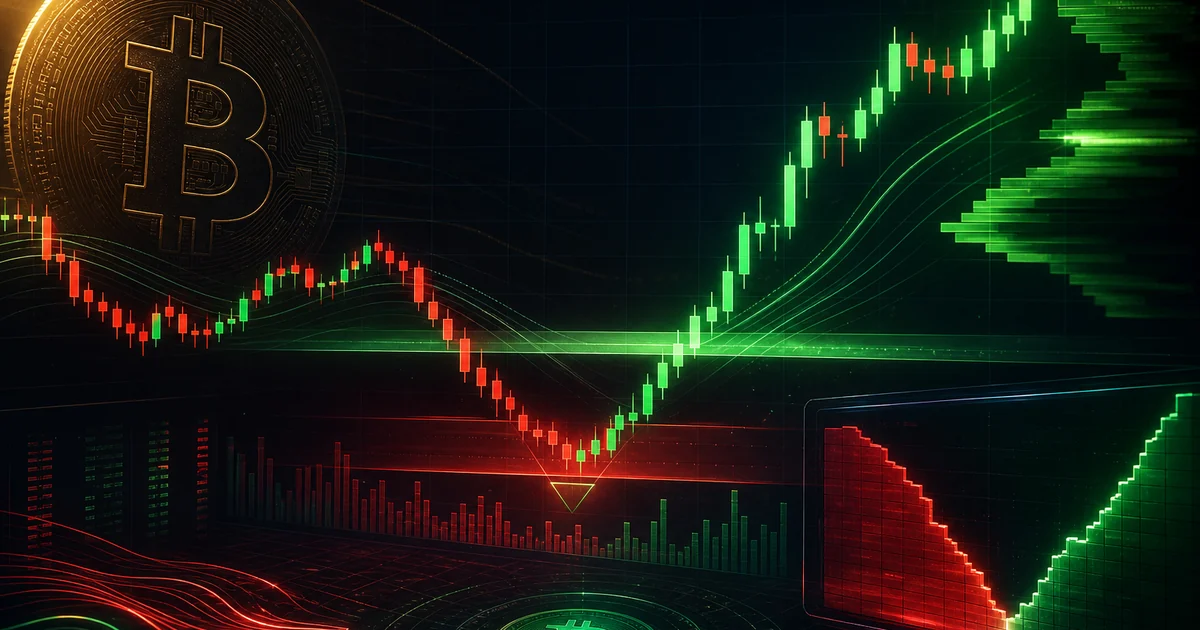
Bitcoin price chart recovering from a 59,000 dollar low back up toward 66,000 dollars
~$66,000
BTC Price
~+12%
Off the Low
23
Fear & Greed
Jun 17
Next Test: Fed

Two weeks ago the story was a brutal crash. Bitcoin had fallen below $61,000, touched a low near $59,130, and sentiment was somewhere on the floor. The mood now is different. Bitcoin has climbed back to around $66,000, briefly tagging $67,000, which puts it roughly 12% above that low. The Fear and Greed Index has lifted off the bottom too, though at 23 it is still sitting in fear.

A bounce like this always raises the same question. Is this the real turn, or just a relief rally before the next leg down? The honest answer needs two things: understanding what actually drove the move, and being clear about the test still sitting directly ahead.

What actually changed

Recoveries that last tend to have real reasons behind them, not just hope. This one has two, and they arrived at roughly the same time.

One: the geopolitical weight lifted

The US-Iran conflict that hammered risk appetite in early June has moved toward a formal resolution, with reporting pointing to a signing later this month. That matters for crypto through oil. The conflict had pushed energy prices up, which fed straight into inflation fears, which is poison for risk assets. As the conflict cooled, oil eased and one of the two big weights on Bitcoin came off. We walked through that exact chain when the rally first started in the Iran de-escalation piece.

Two: institutional demand came back

This is the more important half. After days of spot ETF outflows that pressured price through the crash, the flows turned positive again. Reporting around the recovery points to renewed ETF inflows, Strategy adding to its Bitcoin position once more after its earlier return to buying, and large holders pulling more than 11,000 BTC off exchanges. That last point is the one seasoned traders watch most closely.

Price bouncing tells you buyers showed up. Coins leaving exchanges tells you they plan to hold. Those are two different signals, and the second one is harder to fake.

When coins move off exchanges, the supply sitting ready to be sold shrinks. It is usually read as accumulation, the same footprint we describe in the whale detection guide. One day of it is noise. A steady drain while price recovers is the kind of thing that turns a bounce into a base.

Why this is not an all-clear yet

Now the discipline. A 12% bounce feels good after a crash, but feeling good is not a market signal. Two things keep this from being a confirmed bottom.

First, sentiment is still fragile. A Fear and Greed reading of 23 is an improvement off the lows, but it is still fear, not confidence. Markets that have truly turned usually carry more conviction than this.

Second, and bigger, the recovery has not passed its main test yet. The Federal Reserve decision and updated dot plot land on June 17, the first under new chair Kevin Warsh, which we broke down in the dot plot preview. The rate itself is expected to stay put. The risk is the guidance. A hawkish tone, or a dot plot that pencils in higher rates, would test this bounce immediately. This comes right after the Bank of Japan decision, so the recovery is walking straight into the loudest macro window of the month.

The setup in one line

Two headwinds cleared, geopolitics and ETF flows, and one big test remains, the Fed. A recovery that holds through that test is far more convincing than one that runs into it.

The levels that matter

You do not need to predict the Fed to trade this sensibly. You need to know where the lines are. Reporting around the recovery flags a clear set:

  • Support near $64,000. Holding above it keeps the bounce structurally intact.
  • Resistance near $67,000 to $68,000. A clean break and hold above this band would strengthen the recovery and open room higher.
  • The $60,000 zone below. Losing $64,000 puts this back in focus, the same line that defined the whole $60,000 battle.

How to read the next move: volume

Here is where a bounce proves itself or fails, and it is not in the price candle. It is in the volume behind it. A move back toward $68,000 on thin, fading volume is the kind of rally that traps buyers right before it reverses. The same move on heavy, sustained buying volume across exchanges, with coins still leaving those exchanges, is the signature of real accumulation rather than a short-term squeeze.

That is the difference between a reclaim and a trap, and it shows up in the flow before it shows up as a clean trend on the chart. It is the same idea our guide on why volume moves before price walks through, and it is exactly what CryptoFlow is built to surface in real time.

See if the recovery has real volume behind it

CryptoFlow tracks live buying and selling volume across five major exchanges every minute, so you can tell whether this bounce is real demand or just a squeeze, before the chart confirms it.

Open the Dashboard →

The bottom line

Bitcoin reclaiming $66,000 is a genuine improvement, and it has real reasons behind it: a cooling geopolitical risk and a return of institutional demand, with coins leaving exchanges as the most encouraging detail. The recovery is real. It is also unfinished. Sentiment is still in fear, and the Fed decision is the test that decides whether this bounce becomes a base. Watch $64,000 and $67,000, watch the volume behind any move through them, and let the tape confirm the story before you trust it.

Frequently asked questions

Why is Bitcoin going back up?
Bitcoin recovered from its crash low near $59,000 to around $66,000 on two main drivers. Geopolitical risk eased as the US-Iran conflict moved toward a formal resolution, which pulled oil and inflation fears lower, and institutional demand returned, with spot ETF flows turning positive, Strategy adding to its position, and large holders pulling coins off exchanges.
Is the Bitcoin bottom in?
The bounce is real but not yet confirmed. The Fear and Greed Index is still in fear territory around 23, and the recovery faces its next test at the Federal Reserve decision. A durable bottom needs the reclaim to hold on real volume rather than a thin, headline-driven spike.
What is the next big test for Bitcoin?
The Federal Reserve decision and updated dot plot on June 17. A hawkish tone or a dot plot pointing to higher rates would pressure crypto, while a calmer message would support the recovery. The rate itself is widely expected to stay unchanged, so the guidance is what matters.
What do whale withdrawals from exchanges mean?
When large holders move coins off exchanges, it usually signals accumulation and an intent to hold rather than sell. It reduces the supply immediately available to sell, which is often read as a constructive sign, though it is one signal among many and not a guarantee.
What Bitcoin price levels matter right now?
Reporting around the recovery flags support near $64,000 and resistance near $67,000 to $68,000. Holding above $64,000 keeps the bounce intact, while a clean break above $67,000 to $68,000 would strengthen it. Losing $64,000 would put the $60,000 zone back in focus.
This article is for informational and educational purposes only and does not constitute financial advice. Cryptocurrency is highly volatile. Never invest more than you can afford to lose, and always do your own research. Prices, levels, and figures cited reflect reporting around June 17, 2026 and will change.

البيتكوين يستعيد 66,000 دولار: ما الذي يقف خلف الارتداد، والاختبار الذي أمامه

رسم سعر البيتكوين يتعافى من قاع عند 59 ألف دولار صعوداً نحو 66 ألف دولار
~$66,000
سعر BTC
~+12%
من القاع
23
الخوف والجشع
17 يونيو
الاختبار: الفيدرالي

قبل أسبوعين كانت القصة انهياراً قاسياً. كان البيتكوين قد هبط تحت 61,000 دولار، ولامس قاعاً قرب 59,130، وكانت المعنويات في الحضيض. المزاج الآن مختلف. صعد البيتكوين مجدداً إلى نحو 66,000 دولار، ولامس 67,000 لفترة وجيزة، ما يضعه أعلى من ذلك القاع بنحو 12%. وارتفع مؤشر الخوف والجشع عن القاع أيضاً، وإن كان عند 23 لا يزال في منطقة الخوف.

ارتداد كهذا يطرح السؤال نفسه دائماً. هل هذا التحوّل الحقيقي، أم مجرد ارتفاع تصحيحي قبل موجة هبوط أخرى؟ الإجابة الصادقة تحتاج أمرين: فهم ما حرّك الحركة فعلاً، والوضوح بشأن الاختبار الجالس مباشرة أمامنا.

ما الذي تغيّر فعلاً

التعافيات التي تدوم تميل لأن يكون خلفها أسباب حقيقية، لا مجرد أمل. ولهذا التعافي سببان، وصلا في الوقت نفسه تقريباً.

الأول: ارتفع الثقل الجغرافي السياسي

الصراع بين أمريكا وإيران الذي ضرب شهية المخاطرة مطلع يونيو تحرّك نحو حل رسمي، مع تقارير تشير إلى توقيع في وقت لاحق من الشهر. وهذا يهم الكريبتو عبر النفط. كان الصراع قد دفع أسعار الطاقة للأعلى، ما تغذّى مباشرة في مخاوف التضخم، وهي سمّ للأصول الخطرة. ومع تهدئة الصراع، تراجع النفط وانزاح أحد الثقلين الكبيرين عن البيتكوين. شرحنا تلك السلسلة بالضبط حين بدأ الارتفاع في مقال تهدئة إيران.

الثاني: عاد الطلب المؤسسي

هذا هو النصف الأهم. بعد أيام من التدفقات الخارجة من صناديق ETF التي ضغطت على السعر خلال الانهيار، عادت التدفقات إيجابية. تشير التقارير حول التعافي إلى تدفقات داخلة متجددة لصناديق ETF، وإضافة Strategy إلى حيازتها من البيتكوين مجدداً بعد عودتها السابقة للشراء، وسحب كبار الحائزين أكثر من 11,000 بيتكوين من المنصات. وتلك النقطة الأخيرة هي ما يراقبه المتداولون المخضرمون عن أقرب.

ارتداد السعر يخبرك أن المشترين ظهروا. وخروج العملات من المنصات يخبرك أنهم ينوون الاحتفاظ. هاتان إشارتان مختلفتان، والثانية أصعب تزييفاً.

حين تنتقل العملات خارج المنصات، يتقلّص المعروض الجاهز للبيع. ويُقرأ هذا عادةً كتجميع، البصمة نفسها التي نصفها في دليل اكتشاف الحيتان. يوم واحد منه ضوضاء. أما السحب المستمر بينما يتعافى السعر فهو النوع الذي يحوّل الارتداد إلى قاعدة.

لماذا ليس هذا تصريحاً بزوال الخطر بعد

الآن الانضباط. ارتداد 12% يبدو جيداً بعد انهيار، لكن الشعور الجيد ليس إشارة سوق. أمران يمنعان هذا من أن يكون قاعاً مؤكَّداً.

أولاً، المعنويات لا تزال هشّة. قراءة خوف وجشع عند 23 تحسّن عن القيعان، لكنها لا تزال خوفاً لا ثقة. والأسواق التي تحوّلت فعلاً تحمل عادةً اقتناعاً أكبر من هذا.

ثانياً، والأكبر، لم يجتَز التعافي اختباره الرئيسي بعد. قرار الاحتياطي الفيدرالي ومخطط النقاط المحدّث يصدران في 17 يونيو، الأول تحت الرئيس الجديد كيفن وارش، وهو ما فصّلناه في معاينة مخطط النقاط. الفائدة نفسها يُتوقع أن تبقى ثابتة. والخطر هو التوجيه. نبرة متشددة، أو مخطط نقاط يرسم فائدة أعلى، سيختبر هذا الارتداد فوراً. ويأتي هذا مباشرة بعد قرار بنك اليابان، فالتعافي يسير مباشرة نحو أصخب نافذة اقتصادية في الشهر.

الوضع في سطر

انزاح ثقلان، الجغرافيا السياسية وتدفقات ETF، وبقي اختبار كبير واحد، الفيدرالي. والتعافي الذي يصمد عبر ذلك الاختبار أكثر إقناعاً بكثير من واحد يصطدم به.

المستويات المهمة

لست بحاجة للتنبؤ بالفيدرالي لتتداول هذا بحكمة. أنت بحاجة لمعرفة أين الخطوط. تشير التقارير حول التعافي إلى مجموعة واضحة:

  • دعم قرب 64,000 دولار. الثبات فوقه يُبقي الارتداد سليماً بنيوياً.
  • مقاومة قرب 67,000 إلى 68,000 دولار. اختراق نظيف وثبات فوق هذا النطاق يقوّي التعافي ويفتح مجالاً للأعلى.
  • منطقة 60,000 دولار أسفل. فقدان 64,000 يعيدها إلى الواجهة، الخط نفسه الذي عرّف معركة الـ 60 ألف كلها.

كيف تقرأ الحركة القادمة: الحجم

هنا يثبت الارتداد نفسه أو يفشل، وليس في شمعة السعر. بل في الحجم خلفها. حركة نحو 68,000 على حجم ضعيف متلاشٍ هي نوع الارتفاع الذي يحبس المشترين قبل أن ينعكس مباشرة. والحركة نفسها على حجم شراء ثقيل ومستدام عبر المنصات، مع استمرار خروج العملات من تلك المنصات، هي بصمة التجميع الحقيقي لا الضغطة قصيرة المدى.

ذلك هو الفرق بين الاستعادة والفخ، ويظهر في التدفق قبل أن يظهر كاتجاه واضح على الرسم. إنها الفكرة نفسها التي يشرحها دليلنا عن لماذا يتحرك الحجم قبل السعر، وهي بالضبط ما بُني CryptoFlow لإظهاره في الزمن الحقيقي.

اعرف إن كان خلف التعافي حجم حقيقي

يتتبّع CryptoFlow حجم الشراء والبيع الحي عبر خمس منصات كبرى كل دقيقة، لتعرف إن كان هذا الارتداد طلباً حقيقياً أم مجرد ضغطة، قبل أن يؤكّده الرسم.

افتح لوحة التحكم ←

الخلاصة

استعادة البيتكوين 66,000 دولار تحسّن حقيقي، وخلفه أسباب حقيقية: خطر جغرافي سياسي يبرد وعودة للطلب المؤسسي، مع خروج العملات من المنصات كأكثر التفاصيل تشجيعاً. التعافي حقيقي. وهو أيضاً غير مكتمل. المعنويات لا تزال في الخوف، وقرار الفيدرالي هو الاختبار الذي يحدّد ما إذا كان هذا الارتداد سيصبح قاعدة. راقب 64,000 و67,000، راقب الحجم خلف أي حركة عبرهما، ودع الشريط يؤكّد القصة قبل أن تثق بها.

أسئلة شائعة

لماذا يعود البيتكوين للصعود؟
تعافى البيتكوين من قاع الانهيار قرب 59,000 دولار إلى نحو 66,000 دولار بدافعين رئيسيين. خفّ الخطر الجغرافي السياسي مع تحرّك الصراع بين أمريكا وإيران نحو حل رسمي، ما خفض النفط ومخاوف التضخم، وعاد الطلب المؤسسي، مع تحوّل تدفقات صناديق ETF الفورية للإيجابية، وإضافة Strategy إلى حيازتها، وسحب كبار الحائزين عملات من المنصات.
هل تشكّل قاع البيتكوين؟
الارتداد حقيقي لكنه غير مؤكَّد بعد. لا يزال مؤشر الخوف والجشع في منطقة الخوف قرب 23، ويواجه التعافي اختباره التالي عند قرار الاحتياطي الفيدرالي. والقاع الدائم يحتاج أن تصمد الاستعادة على حجم حقيقي لا قفزة ضعيفة مدفوعة بالعناوين.
ما الاختبار الكبير التالي للبيتكوين؟
قرار الاحتياطي الفيدرالي ومخطط النقاط المحدّث في 17 يونيو. نبرة متشددة أو مخطط نقاط يشير لفائدة أعلى سيضغط على الكريبتو، بينما رسالة أهدأ ستدعم التعافي. الفائدة نفسها يُتوقع على نطاق واسع بقاؤها دون تغيير، فالتوجيه هو ما يهم.
ماذا يعني سحب الحيتان للعملات من المنصات؟
حين ينقل كبار الحائزين عملات خارج المنصات، يشير ذلك عادةً إلى تجميع ونية للاحتفاظ لا للبيع. ويقلّل المعروض المتاح فوراً للبيع، ما يُقرأ غالباً كإشارة بنّاءة، وإن كان إشارة واحدة بين كثيرات لا ضماناً.
ما مستويات سعر البيتكوين المهمة الآن؟
تشير التقارير حول التعافي إلى دعم قرب 64,000 دولار ومقاومة قرب 67,000 إلى 68,000 دولار. الثبات فوق 64,000 يُبقي الارتداد سليماً، بينما اختراق نظيف فوق 67,000 إلى 68,000 يقوّيه. وفقدان 64,000 يعيد منطقة 60,000 إلى الواجهة.
هذا المقال لأغراض إعلامية وتعليمية فقط ولا يشكّل نصيحة مالية. العملات الرقمية شديدة التقلب. لا تستثمر أبداً أكثر مما تتحمّل خسارته، وقم دائماً ببحثك الخاص. الأسعار والمستويات والأرقام المذكورة تعكس تقارير حول 17 يونيو 2026 وستتغيّر.

These links are included so readers can verify the market data, definitions, and official references behind the article.

أُضيفت هذه الروابط حتى يستطيع القارئ التحقق من بيانات السوق، والتعريفات، والمراجع الرسمية المرتبطة بالمقال.