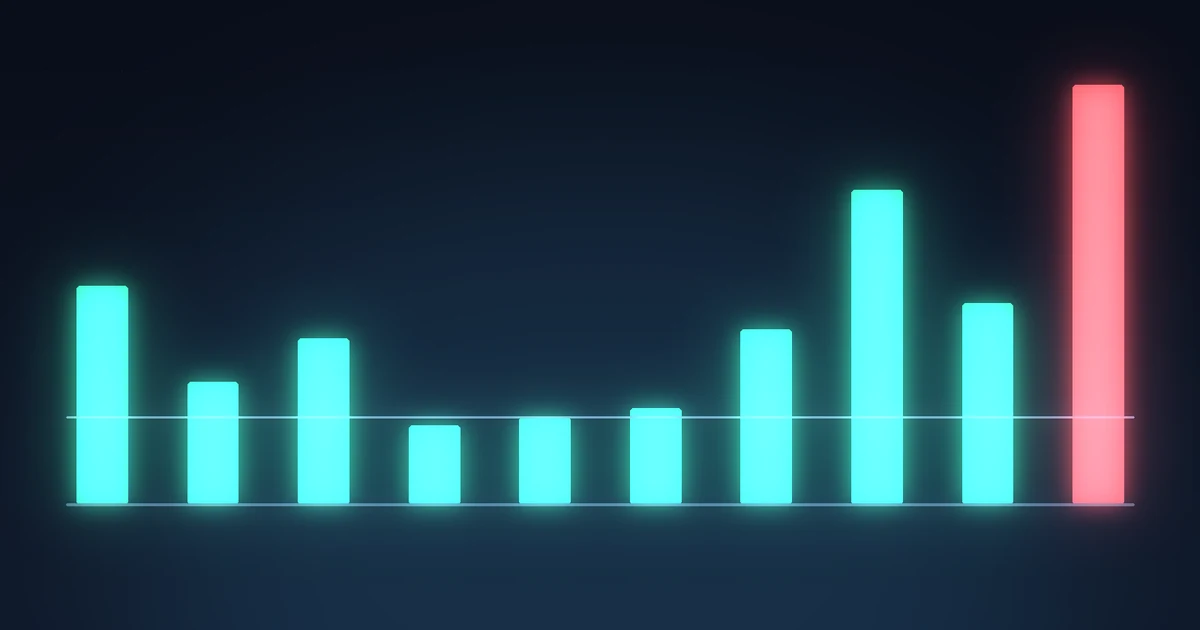
Nine CPI releases, measured at the exact hour
US CPI is released at 8:30am Eastern. That is 13:00 UTC when New York is on standard time and 12:00 UTC when it is on daylight time, so the release hour changes with the clocks. We pinned each one rather than guessing, which matters: our first pass tried to find the release hour by looking for the busiest hour of the morning, and it kept picking 15:00 UTC, which is US equity trading, not the print.
| Release | Data for | Day | Release hour | Hour move | Hour volume | vs average hour |
|---|---|---|---|---|---|---|
| Dec 18, 2025 | Nov 2025 | 0.84% lower | 13:00 | +1.82% | $229M | 2.5x |
| Jan 13, 2026 | Dec 2025 | +4.51% | 13:00 | 0.04% lower | $123M | 1.4x |
| Feb 13, 2026 | Jan 2026 | +3.90% | 13:00 | +0.28% | $109M | 1.9x |
| Mar 11, 2026 | Feb 2026 | +0.35% | 12:00 | +0.27% | $72M | 0.9x |
| Apr 10, 2026 | Mar 2026 | +1.64% | 12:00 | +0.18% | $53M | 1.0x |
| May 12, 2026 | Apr 2026 | 1.52% lower | 12:00 | +0.12% | $47M | 1.1x |
| Jun 10, 2026 | May 2026 | 0.35% lower | 12:00 | +0.87% | $82M | 2.0x |
| Jul 14, 2026 | Jun 2026 | +4.35% | 12:00 | +1.77% | $197M | 3.6x |
| Aug 12, 2026 | Jul 2026 | 0.19% lower | 12:00 | 0.19% lower | $83M | 2.3x |
Three things fall out of that table
The spike is smaller than anyone would guess. Mean 1.9x an average hour, and the release hour carries only 7.8% of the day's volume. On March 11 the CPI hour traded 0.9x, which means the most anticipated scheduled number of the month produced less activity than a random hour of the same day. Two others came in at 1.0x and 1.1x.
The hour does not tell you where the day ends. Release hour direction matched the day's close on five of nine. The days themselves closed higher on five of nine. Two coin flips stacked on each other.
The tape barely changes composition. Mean buy share in the release hour was 52.39% against 50.67% for the whole day. Under two points of difference in the hour that supposedly repriced the Federal Reserve.
What is real is size. Mean absolute move on a CPI day was 1.96% against a 1.62% baseline across the last 300 sessions. So these days run wider than normal. They are just not wider in a direction you can know in advance.
تسعة إصدارات لمؤشر التضخم، مقيسة عند الساعة بالضبط
يصدر مؤشر أسعار المستهلك الأمريكي الساعة 8:30 صباحاً بتوقيت الشرق. وذلك 13:00 بتوقيت غرينتش حين تكون نيويورك على التوقيت القياسي، و12:00 حين تكون على التوقيت الصيفي، فساعة الإصدار تتغير مع تغيّر الساعات. وقد ثبّتنا كل واحدة بدل التخمين، وهذا مهم: فمحاولتنا الأولى بحثت عن ساعة الإصدار بالنظر إلى أكثر ساعات الصباح نشاطاً، فظلت تختار 15:00 بتوقيت غرينتش، وهي ساعة تداول الأسهم الأمريكية لا لحظة الإصدار.
| الإصدار | بيانات شهر | اليوم | ساعة الإصدار | حركة الساعة | حجم الساعة | مقابل الساعة الوسطية |
|---|---|---|---|---|---|---|
| 18 ديسمبر 2025 | نوفمبر 2025 | أقل بـ0.84% | 13:00 | +1.82% | $229M | 2.5x |
| 13 يناير 2026 | ديسمبر 2025 | +4.51% | 13:00 | أقل بـ0.04% | $123M | 1.4x |
| 13 فبراير 2026 | يناير 2026 | +3.90% | 13:00 | +0.28% | $109M | 1.9x |
| 11 مارس 2026 | فبراير 2026 | +0.35% | 12:00 | +0.27% | $72M | 0.9x |
| 10 أبريل 2026 | مارس 2026 | +1.64% | 12:00 | +0.18% | $53M | 1.0x |
| 12 مايو 2026 | أبريل 2026 | أقل بـ1.52% | 12:00 | +0.12% | $47M | 1.1x |
| 10 يونيو 2026 | مايو 2026 | أقل بـ0.35% | 12:00 | +0.87% | $82M | 2.0x |
| 14 يوليو 2026 | يونيو 2026 | +4.35% | 12:00 | +1.77% | $197M | 3.6x |
| 12 أغسطس 2026 | يوليو 2026 | أقل بـ0.19% | 12:00 | أقل بـ0.19% | $83M | 2.3x |
ثلاثة أمور تخرج من ذلك الجدول
القفزة أصغر مما يظن أي أحد. المتوسط 1.9 ضعف الساعة الوسطية، وساعة الإصدار تحمل 7.8% فقط من حجم اليوم. وفي 11 مارس تداولت ساعة المؤشر 0.9 ضعف، ما يعني أن أكثر الأرقام المجدولة ترقّباً في الشهر أنتجت نشاطاً أقل من ساعة عشوائية في اليوم نفسه. واثنتان أخريان جاءتا عند 1.0 و1.1 ضعف.
والساعة لا تخبرك أين ينتهي اليوم. فاتجاه ساعة الإصدار طابق إغلاق اليوم في خمس من تسع. والأيام نفسها أغلقت مرتفعة في خمس من تسع. رميتا عملة فوق بعضهما.
وتركيبة الشريط بالكاد تتغير. فمتوسط حصة الشراء في ساعة الإصدار كان 52.39% مقابل 50.67% لليوم كله. أقل من نقطتين فرقاً في الساعة التي يُفترض أنها أعادت تسعير الاحتياطي الفيدرالي.
أما الحقيقي فهو الحجم. فمتوسط الحركة المطلقة في يوم المؤشر كان 1.96% مقابل خط أساس 1.62% عبر آخر 300 جلسة. فهذه الأيام أوسع من المعتاد. لكنها ليست أوسع في اتجاه يمكنك معرفته مسبقاً.
Then Thursday happened
The August PPI landed at 8:30am Eastern on Thursday September 10, the 12:00 UTC hour. Set it against the nine.
| Measure | Thursday's PPI hour | CPI hours, mean | CPI hours, most extreme |
|---|---|---|---|
| Volume vs an average hour | 4.8x | 1.9x | 3.6x |
| Share of the day's volume | 20.1% | 7.8% | 15.7% |
| Taker buy share | 29.83% | 52.39% | 44.81% |
| Hour move | 1.21% lower | +0.57% | +1.82% |
Every column is an outlier. The hour traded $223 million, more than any CPI release hour in the sample, and carried a fifth of the day's total volume. Its buy share of 29.83% means aggressive sellers took just over 70% of it, and no CPI hour we measured came within fourteen points of that.
The session closed 1.50% lower at $77,129 after touching $76,676. Open interest fell 1.43%, so contracts were being closed rather than opened. That is positions coming off, not a new short being built.
The two hours before were stranger than the release
| Hour, UTC | Move | Volume | Buy share |
|---|---|---|---|
| 09:00 | 0.15% lower | $47M | 25.54% |
| 10:00 | 0.17% lower | $48M | 25.58% |
| 11:00 | 0.03% lower | $51M | 37.12% |
| 12:00, release | 1.21% lower | $223M | 29.83% |
Two hours before the number existed, aggressive sellers were taking 74% of the tape. That is more one sided than the release hour itself.
We are going to report that and stop. Those hours ran on about a fifth of the release hour's volume, and a thin hour produces extreme ratios easily. We cannot see who was selling, whether it was one desk unwinding or a hundred small accounts, and anyone telling you it was informed positioning is guessing. It is a strange reading on a small sample, which is exactly the kind of thing that gets over explained.
ثم جاء الخميس
صدر مؤشر أسعار المنتجين عن أغسطس الساعة 8:30 صباحاً بتوقيت الشرق يوم الخميس 10 سبتمبر، أي ساعة 12:00 بتوقيت غرينتش. ضعها مقابل التسع.
| المقياس | ساعة المنتجين، الخميس | ساعات المستهلك، المتوسط | ساعات المستهلك، الأقصى |
|---|---|---|---|
| الحجم مقابل ساعة وسطية | 4.8x | 1.9x | 3.6x |
| النسبة من حجم اليوم | 20.1% | 7.8% | 15.7% |
| حصة الشراء المتلهّف | 29.83% | 52.39% | 44.81% |
| حركة الساعة | أقل بـ1.21% | +0.57% | +1.82% |
كل عمود قيمة شاذة. فقد تداولت الساعة 223 مليون دولار، أكثر من أي ساعة إصدار للمؤشر في العيّنة، وحملت خُمس حجم اليوم كله. وحصة شرائها البالغة 29.83% تعني أن البائعين المتلهّفين أخذوا ما يزيد قليلاً على 70% منها، ولم تقترب أي ساعة مؤشر قِسناها من ذلك بأربع عشرة نقطة.
وأغلقت الجلسة أقل بـ1.50% عند $77,129 بعد ملامسة $76,676. وهبطت المراكز المفتوحة 1.43%، فالعقود كانت تُغلق لا تُفتح. أي مراكز تُصفّى، لا بيع مكشوف جديد يُبنى.
والساعتان السابقتان أغرب من الإصدار
| الساعة بتوقيت غرينتش | الحركة | الحجم | حصة الشراء |
|---|---|---|---|
| 09:00 | أقل بـ0.15% | $47M | 25.54% |
| 10:00 | أقل بـ0.17% | $48M | 25.58% |
| 11:00 | أقل بـ0.03% | $51M | 37.12% |
| 12:00، الإصدار | أقل بـ1.21% | $223M | 29.83% |
قبل ساعتين من وجود الرقم، كان البائعون المتلهّفون يأخذون 74% من الشريط. وهذا أكثر أحادية من ساعة الإصدار نفسها.
وسنورد ذلك ونتوقف. فتلك الساعتان جرتا على نحو خُمس حجم ساعة الإصدار، والساعة الرقيقة تنتج نسباً متطرفة بسهولة. ولا نستطيع رؤية من كان يبيع، أهو مكتب واحد يفكّ مركزاً أم مئة حساب صغير، ومن يخبرك أنه كان تموضعاً مطّلعاً فهو يخمّن. إنها قراءة غريبة على عيّنة صغيرة، وهذا بالضبط نوع الأشياء التي يُفرَط في تفسيرها.
A correction, and the streak is now seven
First the correction. In Wednesday's article we wrote that "US inflation data is due Thursday September 10". That was the PPI. The CPI, which is the number most readers had in mind, is Friday September 11. Our wording was technically true and practically misleading, and the two prints are a day apart for a reason worth knowing.
Second, the streak. Thursday made it seven consecutive sessions with a taker buy share below 50%, and at 42.20% it is the lowest of the run.
| Session | Close | Buy share |
|---|---|---|
| Fri Sep 4 | $79,661 | 48.36% |
| Sat Sep 5 | $79,832 | 46.67% |
| Sun Sep 6 | $80,342 | 47.58% |
| Mon Sep 7 | $79,112 | 49.00% |
| Tue Sep 8 | $78,456 | 44.42% |
| Wed Sep 9 | $78,306 | 46.86% |
| Thu Sep 10 | $77,129 | 42.20% |
On Wednesday we tested whether a streak like this predicts a bounce, found that the only correctly computed version of the test gave a negative average five session return, and said there was nothing worth trading. Two sessions later the price is lower.
That is consistent with what we published and it is not evidence for it. Two sessions is not a sample. If price had risen 4% we would be writing the same sentence with the sign flipped, and we would rather say that now than after the fact.
What we are watching at 12:30 UTC
We are not forecasting the number or the reaction. But the nine releases above give a specific thing to check, and it takes one glance at the release hour.
If the CPI hour looks like the nine: roughly 1.9 times an average hour, a buy share near 52%, and about 8% of the day's volume. That would be the eleventh straight macro print that the market processed without a crowd, and it would strengthen a claim we have now made from two directions, the other being the nine CLARITY milestones that traded $864 million against an $863 million baseline.
If it looks like Thursday: four times or more a normal hour with a buy share in the twenties or thirties, then two consecutive prints have broken the pattern, and the pattern is the thing that needs rewriting, not the news. We will write that.
Either way the FOMC meets September 15 and 16, with the Senate's CLARITY cloture vote at 2:15pm Eastern on the 15th, so next week stacks two more dated events on top of this one.
تصحيح، والموجة صارت سبعاً
أولاً التصحيح. في مقال الأربعاء كتبنا أن "بيانات التضخم الأمريكية يوم الخميس 10 سبتمبر". وكان ذلك مؤشر أسعار المنتجين. أما مؤشر أسعار المستهلك، وهو الرقم الذي كان في ذهن معظم القراء، فيوم الجمعة 11 سبتمبر. وصياغتنا كانت صحيحة تقنياً ومضلّلة عملياً، والرقمان يفصل بينهما يوم لسبب يستحق المعرفة.
وثانياً الموجة. جعلها الخميس سبع جلسات متتالية بحصة شراء متلهّف تحت 50%، وعند 42.20% هي الأدنى في الموجة.
| الجلسة | الإغلاق | حصة الشراء |
|---|---|---|
| الجمعة 4 سبتمبر | $79,661 | 48.36% |
| السبت 5 سبتمبر | $79,832 | 46.67% |
| الأحد 6 سبتمبر | $80,342 | 47.58% |
| الاثنين 7 سبتمبر | $79,112 | 49.00% |
| الثلاثاء 8 سبتمبر | $78,456 | 44.42% |
| الأربعاء 9 سبتمبر | $78,306 | 46.86% |
| الخميس 10 سبتمبر | $77,129 | 42.20% |
ويوم الأربعاء اختبرنا هل تتنبأ موجة كهذه بارتداد، فوجدنا أن النسخة الوحيدة المحسوبة بشكل صحيح تعطي متوسط عائد خمس جلسات سالباً، وقلنا إنه لا يوجد ما يستحق التداول. وبعد جلستين صار السعر أدنى.
وهذا متسق مع ما نشرناه وهو ليس دليلاً عليه. فجلستان ليستا عيّنة. ولو ارتفع السعر 4% لكنا نكتب الجملة نفسها بإشارة معكوسة، ونفضّل قول ذلك الآن لا بعد وقوعه.
ما نراقبه عند 12:30 بتوقيت غرينتش
نحن لا نتنبأ بالرقم ولا بالتفاعل. لكن الإصدارات التسعة أعلاه تعطي شيئاً محدداً للفحص، ويستغرق نظرة واحدة إلى ساعة الإصدار.
إن بدت ساعة المؤشر كالتسع: نحو 1.9 ضعف الساعة الوسطية، وحصة شراء قرب 52%، ونحو 8% من حجم اليوم. فتلك ستكون الطبعة الكلية الحادية عشرة التي تعالجها السوق دون حشد، وستقوّي ادعاءً صنعناه الآن من اتجاهين، والآخر هو محطات قانون الوضوح التسع التي تداولت 864 مليون دولار مقابل خط أساس 863 مليوناً.
وإن بدت كالخميس: أربعة أضعاف أو أكثر من ساعة عادية بحصة شراء في العشرينات أو الثلاثينات، فتكون طبعتان متتاليتان قد كسرتا النمط، والنمط هو ما يحتاج إعادة كتابة لا الخبر. وسنكتب ذلك.
وفي الحالتين يجتمع الاحتياطي الفيدرالي في 15 و16 سبتمبر، مع تصويت مجلس الشيوخ على إنهاء المناقشة بشأن قانون الوضوح الساعة 2:15 بتوقيت الشرق يوم 15، فالأسبوع القادم يكدّس حدثين مؤرّخين آخرين فوق هذا.