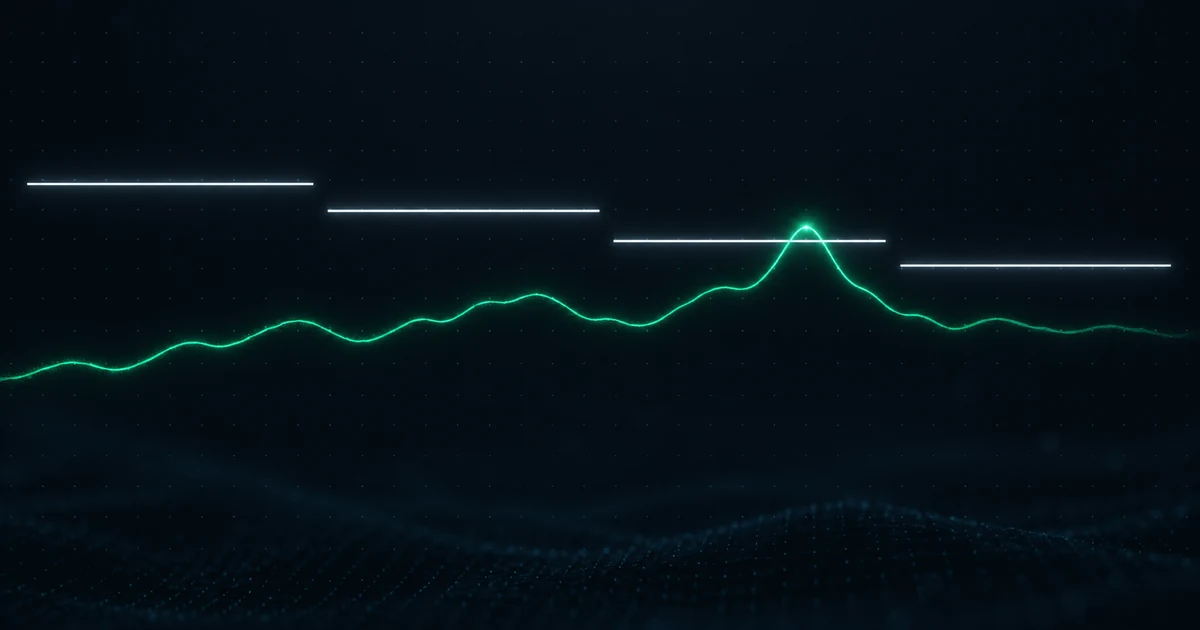
A line it had not closed above since November
The 50-week moving average is the average of the last fifty completed weekly closes. It is slow on purpose. One number summarises about a year of price, which is why crossing it registers as an event rather than noise.
Thursday's close of $81,270.37 was above it. The line for this week, on completed weekly closes only, sits at $81,070.91. That is a margin of $199.46, or 0.25%.
Working back through every daily close on Binance, the previous close above that line was November 11, 2025. The gap is 296 days, and there were no other closes above it anywhere in 2026.
It lasted one session. Friday closed at $79,660.77, which is $1,410 below the line. Saturday closed at $79,831.75. Sunday is partial as we write and trades near $79,840, essentially flat on the session.
The line is also moving
| Week beginning | 50-week average | Change from prior week |
|---|---|---|
| Aug 10 | $83,398 | |
| Aug 17 | $82,491 | $907 lower |
| Aug 24 | $81,823 | $668 lower |
| Aug 31 | $81,071 | $752 lower |
That is $2,327 lower in three weeks, an average of $776 a week, because the strong weeks of late 2025 keep dropping out of the back of the fifty week window. On August 26 we measured this line at $81,823 and on Thursday at $81,071. Both were right for their week. When this week's candle closes tonight, the line moves again, to roughly $80,363.
So the ceiling is descending toward the price at about $700 a week. Reaching it does not require a rally. It requires patience, or nothing at all.
The week is still up 2.78% from its $77,682 open. A green week that fails at the line is not the same thing as a red week, and we would rather state both facts than the convenient one.
خط لم يغلق فوقه منذ نوفمبر
متوسط الخمسين أسبوعاً المتحرك هو متوسط آخر خمسين إغلاقاً أسبوعياً مكتملاً. وهو بطيء عن قصد. فرقم واحد يلخّص نحو سنة من السعر، ولهذا يُسجَّل عبوره حدثاً لا ضجيجاً.
إغلاق الخميس عند $81,270.37 كان فوقه. والخط لهذا الأسبوع، على إغلاقات أسبوعية مكتملة فقط، يقع عند $81,070.91. أي هامش قدره 199.46 دولاراً، أو 0.25%.
وبالرجوع عبر كل إغلاق يومي على Binance، كان الإغلاق السابق فوق ذلك الخط في 11 نوفمبر 2025. والفجوة 296 يوماً، ولم يوجد أي إغلاق آخر فوقه في 2026 كلها.
وصمد جلسة واحدة. فأغلقت الجمعة عند $79,660.77، أي 1,410 دولارات تحت الخط. وأغلق السبت عند $79,831.75. والأحد جزئي وقت الكتابة ويتداول قرب $79,840، أي ثابت تقريباً في الجلسة.
والخط نفسه يتحرك
| بداية الأسبوع | متوسط الخمسين أسبوعاً | التغيّر عن الأسبوع السابق |
|---|---|---|
| 10 أغسطس | $83,398 | |
| 17 أغسطس | $82,491 | أقل بـ907 دولارات |
| 24 أغسطس | $81,823 | أقل بـ668 دولاراً |
| 31 أغسطس | $81,071 | أقل بـ752 دولاراً |
أي أقل بـ2,327 دولاراً في ثلاثة أسابيع، بمعدل 776 دولاراً أسبوعياً، لأن أسابيع أواخر 2025 القوية تخرج تباعاً من مؤخرة نافذة الخمسين أسبوعاً. وفي 26 أغسطس قسنا هذا الخط عند $81,823، ويوم الخميس عند $81,071. وكلاهما صحيح لأسبوعه. وحين تغلق شمعة هذا الأسبوع الليلة، يتحرك الخط مجدداً إلى نحو $80,363.
فالسقف ينزل نحو السعر بنحو 700 دولار أسبوعياً. وبلوغه لا يحتاج صعوداً. يحتاج صبراً، أو لا شيء إطلاقاً.
ولا يزال الأسبوع رابحاً 2.78% من افتتاحه عند $77,682. وأسبوع أخضر يخفق عند الخط ليس كأسبوع أحمر، ونحن نفضّل ذكر الحقيقتين على ذكر المريحة منهما.
The busiest hour of the week went down
The August employment report was released on Friday at 12:30 UTC. It showed 162,000 jobs added, close to triple the 53,000 consensus, with unemployment steady at 4.1% and the June and July figures revised higher. Fed funds futures moved September hike odds from 49.4% to 58% ahead of the September 15 and 16 meeting.
Here is the hour by hour tape on Binance BTCUSDT spot around the release.
| Hour, UTC | Session | Spot volume | Buy share |
|---|---|---|---|
| Fri 11:00 | +0.06% | $41.6M | 52.8% |
| Fri 12:00 | 2.18% lower | $295.3M | 40.6% |
| Fri 13:00 | 0.09% lower | $153.0M | 46.2% |
| Fri 14:00 | 0.58% lower | $143.8M | 45.3% |
| Fri 15:00 | +0.65% | $74.7M | 57.3% |
| Fri 16:00 | +0.40% | $84.4M | 51.2% |
The release hour fell 2.18% on $295.3 million at a 40.6% buy share, which means aggressive sellers took 59.4% of it. That is not a drift. That is people hitting bids.
Now set it beside the rally it undid. Thursday's two working hours were 14:00 at $200.4 million and 15:00 at $246.9 million, the largest hour of that session. Friday's single release hour traded 19.6% more than the biggest hour of Thursday's advance.
Across all four sessions from Thursday to Sunday, the busiest single hour of the week is a down hour. That is the cleanest one line summary of the week we can give you.
Buyers did arrive afterwards. The 15:00 hour gained 0.65% at a 57.3% buy share and 16:00 added 0.40% at 51.2%. They stopped the fall. They did not take it back, and the close finished the day 1.98% lower at $79,660.77.
أكثر ساعات الأسبوع نشاطاً كانت هابطة
صدر تقرير التوظيف عن أغسطس يوم الجمعة عند 12:30 بتوقيت غرينتش. وأظهر إضافة 162,000 وظيفة، أي قرابة ثلاثة أضعاف التوقع البالغ 53,000، مع بطالة ثابتة عند 4.1% ومراجعة رقمَي يونيو ويوليو صعوداً. ورفعت عقود الفائدة الآجلة احتمالات رفع سبتمبر من 49.4% إلى 58% قبل اجتماع 15 و16 سبتمبر.
وهذا شريط التداول ساعةً بساعة على زوج BTCUSDT الفوري في Binance حول الإصدار.
| الساعة بتوقيت غرينتش | الجلسة | حجم فوري | حصة الشراء |
|---|---|---|---|
| الجمعة 11:00 | +0.06% | $41.6M | 52.8% |
| الجمعة 12:00 | أقل بـ2.18% | $295.3M | 40.6% |
| الجمعة 13:00 | أقل بـ0.09% | $153.0M | 46.2% |
| الجمعة 14:00 | أقل بـ0.58% | $143.8M | 45.3% |
| الجمعة 15:00 | +0.65% | $74.7M | 57.3% |
| الجمعة 16:00 | +0.40% | $84.4M | 51.2% |
هبطت ساعة الإصدار 2.18% على 295.3 مليون دولار بحصة شراء 40.6%، ما يعني أن البائعين المتلهّفين أخذوا 59.4% منها. وهذا ليس انسياباً. هذا ضربٌ للعروض القائمة.
والآن ضعها بجوار الصعود الذي نقضته. فساعتا الخميس العاملتان كانتا 14:00 عند 200.4 مليون دولار و15:00 عند 246.9 مليون دولار، وهي أكبر ساعة في تلك الجلسة. أي أن ساعة الإصدار الواحدة يوم الجمعة تداولت أكثر بـ19.6% من أكبر ساعة في صعود الخميس.
وعبر الجلسات الأربع من الخميس إلى الأحد، أكثر ساعة نشاطاً في الأسبوع كله ساعة هابطة. وهذا أنظف تلخيص في سطر واحد نستطيع تقديمه لك عن الأسبوع.
وقد حضر المشترون بعدها. فربحت الساعة 15:00 نسبة 0.65% بحصة شراء 57.3%، وأضافت 16:00 نسبة 0.40% عند 51.2%. فأوقفوا الهبوط. لكنهم لم يستردّوه، وأنهى الإغلاق اليوم أقل بـ1.98% عند $79,660.77.
Two days ago our own tools disagreed. The next two sessions picked one.
On Thursday we published that the buy share and open interest read the same session differently, and that we would show both rather than choose the flattering one. Here is what each said, and here is what followed.
The buy share said conviction: 54.7%, above our 90th percentile of 52.4%, clearly separated from the three failed attempts at 49.8%, 51.0% and 47.1%. Open interest said covering: down 0.60% on the same session, meaning contracts were being closed rather than opened.
| Session | Close | Change | Buy share | Open interest | Long/short |
|---|---|---|---|---|---|
| Thu Sep 3 | $81,270 | +5.08% | 54.7% | 0.60% lower | 1.2148 |
| Fri Sep 4 | $79,661 | 1.98% lower | 48.4% | +4.71% | 0.7816 |
| Sat Sep 5 | $79,832 | +0.21% | 46.7% | 4.26% lower | 1.0165 |
| Sun Sep 6, partial | $79,842 | flat | 45.3% | 1.54% lower | 1.0475 |
Price gave back $1,438.62 of the $3,930.36 gain, which is 36.6%. The buy share fell on three consecutive sessions, from 54.7% to a partial 45.3%. And on the down session, open interest rose.
The covering read is the one that survived contact with the following days.
We want to be exact about what that does and does not mean. It is one resolution of one disagreement. It makes open interest the tool that was right this time, not the better tool in general. We have spent two weeks writing that four observations do not make a rule, and one observation makes even less of one. What it does establish is narrower and more useful: when we said we would not pick, not picking was the correct answer, because we had no basis for picking and the data settled it 48 hours later at no cost to anyone.
Friday's fall was positioning, not panic
That open interest number deserves its own paragraph. On a session where price fell 1.98%, open interest rose 4.71%, from 107,652 BTC to 112,718 BTC. It is the largest single day increase in the thirty days Binance publishes. Falling price with rising open interest means new contracts opened into the weakness. That is people taking a side on the September 15 and 16 meeting, not people being forced out of one.
Then Saturday reversed it: open interest fell 4.26%, the largest single day decrease in the same thirty days. The biggest build and the biggest unwind of the month landed on consecutive sessions.
The account ratio agrees. It settled at 0.7816 on Friday, meaning 56.1% of accounts were positioned short. On Thursday we reported a live intraday reading of 0.7979, and the session finished more skewed rather than less. By Saturday it was 1.0165 and by Sunday 1.0475, so the skew lasted about as long as the line did.
We have now flagged a sub parity reading three times. Once a squeeze followed within a day. Once nothing happened. This time the skew simply unwound with the price roughly flat. Three instances, three different outcomes, which is our own evidence that this configuration describes the present rather than forecasting the future.
قبل يومين اختلفت أدواتنا. والجلستان التاليتان اختارتا واحدة.
يوم الخميس نشرنا أن حصة الشراء والمراكز المفتوحة تقرآن الجلسة نفسها قراءتين مختلفتين، وأننا سنعرض الاثنتين بدل اختيار الأجمل. وهذا ما قالته كل أداة، وهذا ما تلا.
قالت حصة الشراء: قناعة، عند 54.7%، فوق المئين التسعين لدينا البالغ 52.4%، ومنفصلة بوضوح عن المحاولات الثلاث الفاشلة عند 49.8% و51.0% و47.1%. وقالت المراكز المفتوحة: تغطية، بانخفاض 0.60% في الجلسة نفسها، أي أن العقود كانت تُغلق لا تُفتح.
| الجلسة | الإغلاق | التغيّر | حصة الشراء | المراكز المفتوحة | شراء/بيع |
|---|---|---|---|---|---|
| الخميس 3 سبتمبر | $81,270 | +5.08% | 54.7% | أقل بـ0.60% | 1.2148 |
| الجمعة 4 سبتمبر | $79,661 | أقل بـ1.98% | 48.4% | +4.71% | 0.7816 |
| السبت 5 سبتمبر | $79,832 | +0.21% | 46.7% | أقل بـ4.26% | 1.0165 |
| الأحد 6 سبتمبر، جزئي | $79,842 | ثابت | 45.3% | أقل بـ1.54% | 1.0475 |
وأعاد السعر 1,438.62 دولاراً من مكسب 3,930.36 دولاراً، أي 36.6%. وهبطت حصة الشراء في ثلاث جلسات متتالية، من 54.7% إلى 45.3% جزئية. وفي جلسة الهبوط ارتفعت المراكز المفتوحة.
وقراءة التغطية هي التي نجت من الاحتكاك بالأيام التالية.
ونريد الدقة في ما يعنيه ذلك وما لا يعنيه. فهو حسمٌ واحد لخلاف واحد. يجعل المراكز المفتوحة الأداة المحقّة هذه المرة، لا الأداة الأفضل عموماً. وقد أمضينا أسبوعين نكتب أن أربع ملاحظات لا تصنع قاعدة، وملاحظة واحدة تصنع أقل. أما ما يثبته فأضيق وأنفع: حين قلنا إننا لن نختار، كان عدم الاختيار هو الجواب الصحيح، لأننا لم نملك أساساً للاختيار، وحسمت البيانات الأمر بعد 48 ساعة دون كلفة على أحد.
هبوط الجمعة كان تموضعاً لا ذعراً
ورقم المراكز المفتوحة يستحق فقرته. ففي جلسة هبط فيها السعر 1.98%، ارتفعت المراكز المفتوحة 4.71%، من 107,652 بيتكوين إلى 112,718. وهي أكبر زيادة يومية في الثلاثين يوماً التي تنشرها Binance. وهبوط السعر مع صعود المراكز المفتوحة يعني عقوداً جديدة فُتحت داخل الضعف. أي أناس يأخذون موقفاً من اجتماع 15 و16 سبتمبر، لا أناس يُخرَجون من موقف قسراً.
ثم عكس السبت ذلك: هبطت المراكز المفتوحة 4.26%، وهي أكبر انخفاض يومي في الثلاثين يوماً نفسها. فأكبر بناء وأكبر تفكيك في الشهر وقعا في جلستين متتاليتين.
ونسبة الحسابات توافق. فاستقرت عند 0.7816 يوم الجمعة، أي أن 56.1% من الحسابات في مراكز بيع. ويوم الخميس أوردنا قراءة حية أثناء الجلسة عند 0.7979، وانتهت الجلسة أكثر تطرفاً لا أقل. وبحلول السبت صارت 1.0165 والأحد 1.0475، فدام الميل قرابة ما دام الخط.
وقد أشرنا الآن إلى قراءة تحت التعادل ثلاث مرات. في الأولى تبعتها ضغطة خلال يوم. وفي الثانية لم يحدث شيء. وفي هذه انحلّ الميل ببساطة والسعر شبه ثابت. ثلاث حالات بثلاث نتائج مختلفة، وهو دليلنا نحن على أن هذا الإعداد يصف الحاضر ولا يتنبأ بالمستقبل.
The biggest up day of the run was also the thinnest
Here is a measurement we had not made before this week. Take the twelve largest single day gains in the last 400 sessions, then sort them by how much actually traded.
| Session | Gain | Close | Spot volume |
|---|---|---|---|
| Feb 6 | +12.19% | $70,580 | $6.13B |
| Aug 21 | +7.27% | $78,338 | $3.40B |
| Mar 4 | +6.33% | $72,667 | $3.20B |
| Aug 20 | +5.32% | $73,025 | $2.56B |
| Dec 2, 2025 | +5.79% | $91,278 | $2.52B |
| Mar 2 | +4.64% | $68,830 | $2.16B |
| Jan 13 | +4.51% | $95,414 | $2.15B |
| Feb 25 | +6.13% | $67,988 | $2.06B |
| Mar 23 | +4.49% | $70,906 | $1.98B |
| Aug 19 | +7.12% | $69,335 | $1.95B |
| Apr 13 | +5.20% | $74,418 | $1.75B |
| Sep 3 | +5.08% | $81,270 | $1.58B |
Thursday is last. Its $1.58 billion is the smallest of the twelve: 46.4% of the August 21 session thirteen days earlier, and about a quarter of the February 6 session.
Put another way, across those same 400 sessions Thursday's volume ranks 255th, the 64th percentile. A session in the top 2.3% by size traded in the middle of the pack by activity.
This is not a criticism of the move. Price is price and the close was real. It is an observation about who was in the room. The largest advance of this run happened with fewer participants than any comparable advance in fourteen months.
And the same session set an ETF record
Reporting puts US spot Bitcoin ETF inflows at $730.9 million on Thursday, the largest single day since January 14. We did not measure that and we are relaying it.
Side by side those two facts look contradictory: the biggest ETF day in almost eight months landed on the thinnest big up day in 400 sessions. They are not contradictory. This is the first of the three blind spots we have documented on this site. ETF creations settle between the issuer and its authorised participants, away from the public order book. Whatever they bought, and wherever they bought it, our taker buy share never saw it.
So the thin tape is not evidence that nobody was buying. It is evidence that whoever was buying was not doing it where we can watch.
أكبر يوم صاعد في الموجة كان أرقّها أيضاً
وهذا قياس لم نُجرِه قبل هذا الأسبوع. خذ أكبر اثني عشر مكسباً يومياً في آخر 400 جلسة، ثم رتّبها بحسب ما تداول فعلاً.
| الجلسة | المكسب | الإغلاق | حجم فوري |
|---|---|---|---|
| 6 فبراير | +12.19% | $70,580 | $6.13B |
| 21 أغسطس | +7.27% | $78,338 | $3.40B |
| 4 مارس | +6.33% | $72,667 | $3.20B |
| 20 أغسطس | +5.32% | $73,025 | $2.56B |
| 2 ديسمبر 2025 | +5.79% | $91,278 | $2.52B |
| 2 مارس | +4.64% | $68,830 | $2.16B |
| 13 يناير | +4.51% | $95,414 | $2.15B |
| 25 فبراير | +6.13% | $67,988 | $2.06B |
| 23 مارس | +4.49% | $70,906 | $1.98B |
| 19 أغسطس | +7.12% | $69,335 | $1.95B |
| 13 أبريل | +5.20% | $74,418 | $1.75B |
| 3 سبتمبر | +5.08% | $81,270 | $1.58B |
الخميس في المرتبة الأخيرة. فحجمه البالغ 1.58 مليار دولار هو الأصغر بين الاثني عشر: 46.4% من جلسة 21 أغسطس قبله بثلاثة عشر يوماً، ونحو ربع جلسة 6 فبراير.
وبعبارة أخرى، عبر الـ400 جلسة نفسها يحتل حجم الخميس المرتبة 255، أي المئين الرابع والستين. فجلسة ضمن أعلى 2.3% حجماً في الحركة تداولت في وسط القافلة نشاطاً.
وهذا ليس انتقاداً للحركة. فالسعر سعر والإغلاق حقيقي. إنه ملاحظة عمّن كان في الغرفة. فأكبر تقدّم في هذه الموجة حدث بمشاركين أقل من أي تقدّم مماثل خلال أربعة عشر شهراً.
والجلسة نفسها سجّلت رقماً قياسياً للصناديق
تُورد التقارير تدفقات صناديق البيتكوين الفورية الأمريكية عند 730.9 مليون دولار يوم الخميس، وهو أكبر يوم منفرد منذ 14 يناير. ونحن لم نقِس ذلك وإنما ننقله.
وجنباً إلى جنب تبدو الحقيقتان متناقضتين: أكبر يوم للصناديق منذ ثمانية أشهر تقريباً وقع في أرقّ يوم صاعد كبير في 400 جلسة. وهما ليستا متناقضتين. فهذه أولى النقاط العمياء الثلاث التي وثّقناها في هذا الموقع. إذ تُسوّى إصدارات الصناديق بين المُصدِر والمشاركين المعتمدين لديه، بعيداً عن دفتر الأوامر العام. فمهما اشتروا، وأينما اشتروا، لا تراه حصة الشراء المتلهّف لدينا إطلاقاً.
فالشريط الرقيق ليس دليلاً على أن أحداً لم يشترِ. إنه دليل على أن من اشترى لم يفعلها حيث نستطيع المراقبة.
What people are actually searching for
Attention is the other half of a market, so it is worth measuring too. These are third party search estimates rather than our own data, and we label them that way for the same reason we label a partial session.
| Search term | Estimated monthly volume | Reported change |
|---|---|---|
| Bitcoin | 3.35M | 33% lower year over year |
| Day trading | 246K | about 5x |
| Clarity Act | 201K | about 25x |
| Crypto ATMs | 110K | more than 12x year over year |
| Tokenization | 18.1K | +22% |
| AI trade | 14.8K | +83% |
| Prediction markets | 14.8K | very large, off a small base |
On the normalised search index, global crypto interest had fallen to a band of 26 to 30 by June 2026 against the August 2025 peak.
The pattern is not that attention left. It is that attention moved: away from the price of the asset and toward the rules around it, the machines under it and the places to trade it. The single fastest growing term on that list is a piece of legislation.
And this is where the previous section earns its place. We can check the exchange analogue of that claim ourselves, and it agrees. The largest up day of this entire run traded less than half the volume of a smaller up day thirteen days earlier. Two independent measures of attention, one from a search engine and one from an order book, describing the same period the same way. We would not lean on either alone. Together they are worth a paragraph.
The most searched question, answered with numbers
The most searched crypto question of 2026 is some variant of why is Bitcoin down today. For Friday, September 4, the answer has four parts and only the last one is guesswork.
The trigger is reported. Payrolls at roughly triple the forecast, and September hike odds moving from 49.4% to 58%.
The mechanism is measured. A 2.18% fall in a single hour, on $295.3 million, at a 40.6% buy share. Sellers were the urgent side and they were urgent for sixty minutes.
The character is measured. Open interest rose 4.71% that day, the largest daily build in thirty days. Contracts opened rather than closed, so this was positioning ahead of a meeting, not forced liquidation.
The fourth part is what happens next, and we do not do that. The numbers above are the reason. The same buy share that separated Thursday's success from three failures then fell for three straight sessions without telling anyone where the price would be on Monday.
عمّا يبحث الناس فعلاً
الانتباه هو النصف الآخر من أي سوق، فيستحق القياس هو أيضاً. وهذه تقديرات بحث من طرف ثالث لا بيانات لنا، ونسِمُها كذلك للسبب نفسه الذي نسِم به جلسة جزئية.
| عبارة البحث | حجم شهري تقديري | التغيّر المُبلَّغ |
|---|---|---|
| بيتكوين | 3.35M | أقل بـ33% عن العام السابق |
| التداول اليومي | 246K | نحو 5 أضعاف |
| قانون الوضوح | 201K | نحو 25 ضعفاً |
| صرافات الكريبتو | 110K | أكثر من 12 ضعفاً سنوياً |
| الترميز | 18.1K | +22% |
| تداول الذكاء الاصطناعي | 14.8K | +83% |
| أسواق التنبؤ | 14.8K | كبير جداً من قاعدة صغيرة |
وعلى مؤشر البحث المعياري، هبط الاهتمام العالمي بالكريبتو إلى نطاق 26 إلى 30 بحلول يونيو 2026 مقابل ذروة أغسطس 2025.
والنمط ليس أن الانتباه رحل. بل أن الانتباه انتقل: بعيداً عن سعر الأصل، ونحو القواعد المحيطة به، والآلات تحته، وأماكن تداوله. وأسرع عبارة نمواً في تلك القائمة تشريعٌ قانوني.
وهنا يستحق القسم السابق مكانه. فنحن نستطيع فحص نظير ذلك الادعاء في المنصات بأنفسنا، وهو يوافق. إذ تداول أكبر يوم صاعد في هذه الموجة كلها أقل من نصف حجم يوم صاعد أصغر قبله بثلاثة عشر يوماً. مقياسان مستقلان للانتباه، أحدهما من محرك بحث والآخر من دفتر أوامر، يصفان الفترة نفسها الوصف نفسه. ولن نتّكئ على أيٍّ منهما وحده. ومعاً يستحقان فقرة.
أكثر الأسئلة بحثاً، مُجاباً بالأرقام
أكثر أسئلة الكريبتو بحثاً في 2026 صيغةٌ ما من لماذا ينخفض البيتكوين اليوم. وبالنسبة ليوم الجمعة 4 سبتمبر، للجواب أربعة أجزاء، والأخير وحده تخمين.
المُشعل مُبلَّغ. رقم وظائف عند نحو ثلاثة أضعاف التوقع، واحتمالات رفع سبتمبر تتحرك من 49.4% إلى 58%.
الآلية مقيسة. هبوط 2.18% في ساعة واحدة، على 295.3 مليون دولار، بحصة شراء 40.6%. فالبائعون كانوا الطرف المستعجل، وكانوا مستعجلين ستين دقيقة.
الطابع مقيس. ارتفعت المراكز المفتوحة 4.71% ذلك اليوم، وهو أكبر بناء يومي في ثلاثين يوماً. فالعقود فُتحت لا أُغلقت، وهذا تموضعٌ قبل اجتماع لا تصفية قسرية.
والجزء الرابع هو ما سيحدث لاحقاً، وهذا لا نفعله. والأرقام أعلاه هي السبب. فحصة الشراء نفسها التي فصلت نجاح الخميس عن ثلاثة إخفاقات هبطت بعدها ثلاث جلسات متتالية دون أن تخبر أحداً أين سيكون السعر يوم الاثنين.
What we cannot see this week
Three things move price that no taker metric on any venue can observe, and all three were live across these four sessions.
ETF creations. $730.9 million on Thursday, settled off the public book. Our buy share cannot see it, and neither can anyone else's.
Futures liquidations. The perpetual book is roughly fifteen times the size of the spot book we measure. Friday was less liquidation driven than usual, since open interest rose rather than fell, but the structural point holds. Our spot tape is the smaller room.
Maker repricing. When a resting order is cancelled and replaced lower, no trade happens and nothing is recorded. Price can travel a long way on very little volume this way, and the 12:00 hour on Friday almost certainly contained some of it.
There is a fourth limit, and the search table quietly points at it. We measure Binance. If attention is genuinely moving toward regulated venues, crypto ATMs and prediction markets, then a growing share of what matters is happening somewhere our data does not reach. That is not a flaw we can fix with a better query. It is a property of the instrument, and the honest response is to name it rather than to widen the claim.
ما لا نستطيع رؤيته هذا الأسبوع
ثلاثة أمور تحرّك السعر ولا يستطيع أي مقياس تلهّف في أي منصة رصدها، وكانت الثلاثة نشطة عبر هذه الجلسات الأربع.
إصدارات الصناديق. 730.9 مليون دولار يوم الخميس، تُسوّى خارج الدفتر العام. ولا تراها حصة الشراء لدينا، ولا حصة أي أحد آخر.
تصفيات العقود الآجلة. دفتر العقود الدائمة أكبر نحو خمسة عشر ضعفاً من الدفتر الفوري الذي نقيسه. وكانت الجمعة أقل اعتماداً على التصفية من المعتاد، إذ ارتفعت المراكز المفتوحة ولم تهبط، لكن النقطة البنيوية قائمة. فشريطنا الفوري هو الغرفة الأصغر.
إعادة تسعير صانعي السوق. حين يُلغى أمر قائم ويُستبدل بأدنى منه، لا تقع صفقة ولا يُسجَّل شيء. ويستطيع السعر قطع مسافة طويلة بحجم ضئيل جداً بهذه الطريقة، وشبه المؤكد أن ساعة 12:00 يوم الجمعة احتوت شيئاً من ذلك.
وثمة حدٌّ رابع، وجدول البحث يشير إليه بهدوء. فنحن نقيس Binance. وإن كان الانتباه ينتقل فعلاً نحو المنصات المنظّمة وصرافات الكريبتو وأسواق التنبؤ، فإن حصةً متنامية مما يهم تحدث في مكان لا تبلغه بياناتنا. وهذا ليس عيباً نصلحه باستعلام أفضل. إنه خاصية في الأداة، والرد الأمين تسميتها لا توسيع الادعاء.