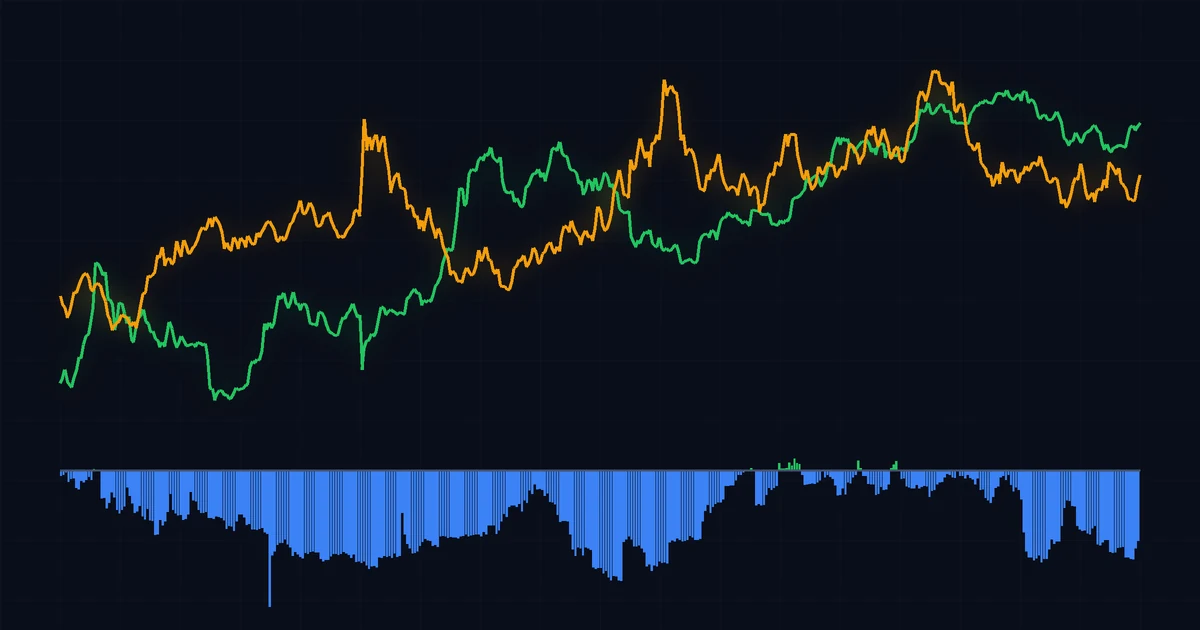
What the dollar index is
A currency has no price of its own. It only has exchange rates against other currencies, and on any given day the dollar can be up against the yen and down against the euro. A dollar index solves that by averaging many exchange rates into a single number. When the index rises, the dollar buys more foreign currency than before. When it falls, it buys less.
The one most people mean is the US Dollar Index, ticker DXY, maintained by ICE (Intercontinental Exchange). It compares the dollar with six currencies, using weights that have changed only once, when the euro replaced several European currencies in 1999:
| Currency | Weight in DXY |
|---|---|
| Euro | 57.6% |
| Japanese yen | 13.6% |
| British pound | 11.9% |
| Canadian dollar | 9.1% |
| Swedish krona | 4.2% |
| Swiss franc | 3.6% |
The index is a weighted geometric average measured against a base of 100 set in March 1973, shortly after the dollar began to float freely. A reading of 98 means the dollar is about 2% weaker against this basket than it was then.
Notice what is missing. China, Mexico, South Korea and India, among the largest US trading partners, have no weight at all. More than half of DXY is simply the euro. That is why some analysts call it a euro index turned upside down.
ما مؤشر الدولار
ليس للعملة سعر خاص بها. لها فقط أسعار صرف مقابل العملات الأخرى، وفي أي يوم قد يرتفع الدولار أمام الين وينخفض أمام اليورو. ومؤشر الدولار يحل هذه المشكلة بجمع أسعار صرف كثيرة في رقم واحد. فإذا ارتفع المؤشر، صار الدولار يشتري عملة أجنبية أكثر من ذي قبل. وإذا انخفض، صار يشتري أقل.
والمؤشر الذي يقصده أغلب الناس هو مؤشر الدولار الأمريكي، ورمزه DXY، وتديره شركة ICE (البورصة القارية). وهو يقارن الدولار بست عملات، بأوزان لم تتغير إلا مرة واحدة، حين حل اليورو محل عدة عملات أوروبية في 1999:
| العملة | الوزن في DXY |
|---|---|
| اليورو | 57.6% |
| الين الياباني | 13.6% |
| الجنيه الإسترليني | 11.9% |
| الدولار الكندي | 9.1% |
| الكرونة السويدية | 4.2% |
| الفرنك السويسري | 3.6% |
والمؤشر متوسط هندسي مرجّح يُقاس على أساس 100 حُدد في مارس 1973، بعد وقت قصير من بدء تعويم الدولار بحرية. فقراءة 98 تعني أن الدولار أضعف بنحو 2% أمام هذه السلة مما كان عليه آنذاك.
ولاحظ ما هو غائب. فالصين والمكسيك وكوريا الجنوبية والهند، وهي من أكبر الشركاء التجاريين للولايات المتحدة، ليس لها أي وزن. وأكثر من نصف DXY هو اليورو ببساطة. ولهذا يصفه بعض المحللين بأنه مؤشر لليورو مقلوب رأساً على عقب.
The other dollar index: the Fed's broad index
The Federal Reserve publishes its own measure, the nominal broad dollar index. It covers 26 currencies, chosen because each accounts for at least 0.5% of US trade, and its weights follow actual trade flows and are updated every year. It is set to 100 in January 2006. FRED carries the daily series as DTWEXBGS, and it is the series we use for our measurement below.
The largest weights for 2026, as published by the Fed:
| Economy | Weight in the broad index, 2026 |
|---|---|
| Euro area | 21.0% |
| Mexico | 14.8% |
| Canada | 12.8% |
| China | 10.9% |
| United Kingdom | 5.2% |
| Japan | 5.2% |
When the two disagree: the first half of 2025
The difference is not academic. In the first half of 2025, DXY fell about 10.7%, its worst first half since 1973, as widely reported at the time. Over the same six months the broad index fell from 129.28 to 119.41, a drop of 7.6% (our calculation from FRED). The euro, the yen and the Swiss franc all gained more than 10% against the dollar, and those currencies dominate DXY. The peso and the yuan, which matter far more in the broad index, moved less.
Rule of thumb: DXY tells you how the dollar is doing against other rich-world currencies, which is what most traders watch. The broad index tells you how the dollar is doing against the world it actually trades with.
مؤشر الدولار الآخر: مؤشر الفيدرالي الواسع
ينشر الاحتياطي الفيدرالي مقياسه الخاص، وهو مؤشر الدولار الاسمي الواسع. ويغطي 26 عملة، اختيرت لأن كلاً منها يمثل 0.5% على الأقل من التجارة الأمريكية، وتتبع أوزانه تدفقات التجارة الفعلية وتُحدَّث كل عام. وقيمته الأساسية 100 في يناير 2006. وتنشر FRED السلسلة اليومية بالرمز DTWEXBGS، وهي السلسلة التي نستخدمها في قياسنا أدناه.
أكبر الأوزان لعام 2026، كما نشرها الفيدرالي:
| الاقتصاد | الوزن في المؤشر الواسع، 2026 |
|---|---|
| منطقة اليورو | 21.0% |
| المكسيك | 14.8% |
| كندا | 12.8% |
| الصين | 10.9% |
| المملكة المتحدة | 5.2% |
| اليابان | 5.2% |
حين يختلف المؤشران: النصف الأول من 2025
الفرق ليس نظرياً. ففي النصف الأول من 2025، انخفض DXY بنحو 10.7%، في أسوأ نصف أول له منذ 1973، كما أُفيد على نطاق واسع حينها. وخلال الأشهر الستة نفسها انخفض المؤشر الواسع من 129.28 إلى 119.41، أي بنسبة 7.6% (بحسب حسابنا من بيانات FRED). فقد ارتفع اليورو والين والفرنك السويسري جميعاً بأكثر من 10% أمام الدولار، وهذه العملات تهيمن على DXY. أما البيزو واليوان، وهما أهم بكثير في المؤشر الواسع، فتحركا أقل.
والقاعدة العملية: DXY يخبرك بأداء الدولار أمام عملات الدول الغنية الأخرى، وهو ما يراقبه أغلب المتداولين. والمؤشر الواسع يخبرك بأداء الدولار أمام العالم الذي يتاجر معه فعلاً.
How to read a dollar index
Direction first, level second. A level of 120 on the broad index means nothing on its own. What matters is the change over weeks and months.
Scale your expectations. Currencies move slowly compared with crypto. On our data since 2017, the broad index has a typical weekly move (standard deviation) of 0.70% and a typical monthly move of 1.57%. Bitcoin's are 9.33% and 20.25%, about 13 times larger. So a 1% month for the dollar is a notable month, and a 3% month is rare: it has happened only six times in 108 months.
Ask why it moved. The dollar usually rises for one of two reasons. Either US interest rates are expected to rise relative to other countries, which pulls money into dollar assets, or investors are frightened and run to the safest cash they can find. Both are bad for risk assets, but for different reasons. The dollar falls when the reverse happens, or when confidence in US policy itself is shaken, as in 2025.
كيف تقرأ مؤشر الدولار
الاتجاه أولاً، والمستوى ثانياً. مستوى 120 في المؤشر الواسع لا يعني شيئاً بمفرده. المهم هو التغير على مدى أسابيع وأشهر.
اضبط توقعاتك. العملات بطيئة الحركة مقارنةً بالكريبتو. فبحسب بياناتنا منذ 2017، تبلغ الحركة الأسبوعية المعتادة للمؤشر الواسع (الانحراف المعياري) 0.70%، والحركة الشهرية المعتادة 1.57%. أما البيتكوين فحركتاه 9.33% و20.25%، أي أكبر بنحو 13 مرة. فشهر يتحرك فيه الدولار 1% شهر لافت، وشهر بـ3% نادر: لم يحدث سوى ست مرات في 108 أشهر.
اسأل لماذا تحرك. يرتفع الدولار عادةً لأحد سببين. إما أن يُتوقع ارتفاع الفائدة الأمريكية مقارنةً بالدول الأخرى، فتنجذب الأموال إلى الأصول الدولارية، وإما أن يخاف المستثمرون فيهرعوا إلى أكثر أشكال النقد أماناً. وكلاهما سيئ للأصول عالية المخاطر، لكن لأسباب مختلفة. وينخفض الدولار حين يحدث العكس، أو حين تهتز الثقة في السياسة الأمريكية نفسها، كما حدث في 2025.
Where the dollar stands now
Key levels of the broad index from FRED, with the dates they were reached:
| Point | Date | Broad index |
|---|---|---|
| 2021 low | Jun 1, 2021 | 110.50 |
| 2022 peak, Fed hiking fast | Sep 26, 2022 | 128.45 |
| Highest since 2006 | Jan 13, 2025 | 130.04 |
| Low after the 2025 slide | Jan 29, 2026 | 117.44 |
| Latest available | Sep 25, 2026 | 120.33 |
So the dollar is about 7.5% below its January 2025 peak, a little above its January 2026 low, and up just 0.49% since the end of 2025. After a big fall, it has spent 2026 mostly going sideways. The Fed's next H.10 release is due this afternoon, Monday October 5, at 4:15 p.m. New York time.
أين يقف الدولار الآن
المستويات الرئيسية للمؤشر الواسع من FRED، مع تواريخ بلوغها:
| النقطة | التاريخ | المؤشر الواسع |
|---|---|---|
| أدنى مستوى في 2021 | 1 يونيو 2021 | 110.50 |
| ذروة 2022، والفيدرالي يرفع الفائدة بسرعة | 26 سبتمبر 2022 | 128.45 |
| الأعلى منذ 2006 | 13 يناير 2025 | 130.04 |
| القاع بعد تراجع 2025 | 29 يناير 2026 | 117.44 |
| آخر قراءة متاحة | 25 سبتمبر 2026 | 120.33 |
فالدولار أدنى بنحو 7.5% من ذروة يناير 2025، وأعلى قليلاً من قاع يناير 2026، ومرتفع بنسبة 0.49% فقط منذ نهاية 2025. وبعد هبوط كبير، قضى 2026 في الغالب يتحرك أفقياً. والنشرة التالية H.10 من الفيدرالي موعدها عصر اليوم، الإثنين 5 أكتوبر، عند الرابعة والربع مساءً بتوقيت نيويورك.
Why the dollar should matter to Bitcoin
Bitcoin is quoted in dollars almost everywhere, so a weaker dollar mechanically lifts the dollar price of anything priced globally, a bit like gold. That effect is small, because currencies move so little.
The bigger channel is money conditions. A strong dollar usually comes with high US interest rates, which make holding an asset that pays no yield more expensive, and it tightens financing for borrowers around the world who owe dollars. A falling dollar tends to come with the opposite: easier money and more appetite for risk. We covered the interest rate side of this in our real interest rates explainer.
That is the theory. Now the data.
لماذا ينبغي أن يهم الدولار البيتكوين
يُسعَّر البيتكوين بالدولار في كل مكان تقريباً، فالدولار الأضعف يرفع آلياً السعر الدولاري لأي أصل يُسعَّر عالمياً، على غرار الذهب. وهذا الأثر صغير، لأن العملات تتحرك قليلاً جداً.
والقناة الأكبر هي أوضاع السيولة. فالدولار القوي يأتي عادةً مع فائدة أمريكية مرتفعة، تجعل الاحتفاظ بأصل لا يدر عائداً أكثر كلفة، ويشدد التمويل على المقترضين حول العالم المدينين بالدولار. أما الدولار المتراجع فيميل إلى أن يأتي مع العكس: نقد أيسر وشهية أكبر للمخاطرة. وقد تناولنا جانب الفائدة من هذا في شرحنا لأسعار الفائدة الحقيقية.
هذه هي النظرية. والآن البيانات.
Our measurement: 475 weeks of the dollar and Bitcoin
We took the Fed's broad dollar index from FRED and Bitcoin's daily close on Binance (BTCUSDT), and measured Friday to Friday changes from August 2017 to September 25, 2026: 475 weeks. We used weekly rather than daily changes because the Fed records exchange rates at noon New York time while Bitcoin's daily candle closes at midnight UTC, and daily figures would mix up the timing. All numbers in this section are our calculations.
The correlation of weekly changes over the whole period is minus 0.175. Negative means they tend to move in opposite directions. But it is small. Squared, it says dollar moves explain about 3% of Bitcoin's week to week swings. The other 97% is everything else.
| Year | Weeks | Correlation of weekly changes |
|---|---|---|
| 2018 | 52 | -0.13 |
| 2019 | 52 | -0.17 |
| 2020 | 52 | -0.37 |
| 2021 | 53 | -0.17 |
| 2022 | 52 | -0.30 |
| 2023 | 52 | -0.07 |
| 2024 | 52 | -0.06 |
| 2025 | 52 | -0.33 |
| 2026, to Sep 25 | 39 | -0.24 |
What stands out is how consistent the sign is. We also calculated the correlation over every rolling 52-week window. It was negative in 406 of 424 windows, or 95.8%. The most negative was the year ending March 13, 2020, the week of the pandemic crash, at minus 0.53. The highest was only plus 0.04, in February 2024. The latest window, ending September 25, 2026, reads minus 0.27.
The link gets stronger in years of stress (2020, 2022, 2025) and almost disappears in calmer years (2023, 2024). That fits the idea that the dollar matters most for Bitcoin when big macro forces are driving both at once.
قياسنا: 475 أسبوعاً من الدولار والبيتكوين
أخذنا مؤشر الدولار الواسع من FRED، وسعر الإغلاق اليومي للبيتكوين على Binance (زوج BTCUSDT)، وقسنا التغيرات من جمعة إلى جمعة من أغسطس 2017 حتى 25 سبتمبر 2026: 475 أسبوعاً. واستخدمنا التغيرات الأسبوعية لا اليومية لأن الفيدرالي يسجل أسعار الصرف ظهراً بتوقيت نيويورك بينما تُغلق الشمعة اليومية للبيتكوين عند منتصف الليل بالتوقيت العالمي، فالأرقام اليومية كانت ستخلط التوقيت. وكل الأرقام في هذا القسم من حساباتنا.
ومعامل الارتباط بين التغيرات الأسبوعية على كامل الفترة سالب 0.175. والسالب يعني أنهما يميلان إلى التحرك في اتجاهين متعاكسين. لكنه صغير. فمربعه يقول إن حركة الدولار تفسر نحو 3% فقط من تقلبات البيتكوين من أسبوع لآخر. والـ97% الباقية تعود إلى كل شيء آخر.
| السنة | الأسابيع | ارتباط التغيرات الأسبوعية |
|---|---|---|
| 2018 | 52 | -0.13 |
| 2019 | 52 | -0.17 |
| 2020 | 52 | -0.37 |
| 2021 | 53 | -0.17 |
| 2022 | 52 | -0.30 |
| 2023 | 52 | -0.07 |
| 2024 | 52 | -0.06 |
| 2025 | 52 | -0.33 |
| 2026، حتى 25 سبتمبر | 39 | -0.24 |
واللافت هو ثبات الإشارة. فقد حسبنا الارتباط أيضاً على كل نافذة متحركة طولها 52 أسبوعاً. وجاء سالباً في 406 من 424 نافذة، أي 95.8%. وكانت أكثر النوافذ سلبية السنة المنتهية في 13 مارس 2020، أسبوع انهيار الجائحة، عند سالب 0.53. وكانت أعلاها موجب 0.04 فقط، في فبراير 2024. وتقرأ النافذة الأخيرة، المنتهية في 25 سبتمبر 2026، سالب 0.27.
وتقوى الصلة في سنوات الضغط (2020 و2022 و2025) وتكاد تختفي في السنوات الأهدأ (2023 و2024). وهذا يتسق مع فكرة أن الدولار يهم البيتكوين أكثر ما يكون حين تحرك القوى الاقتصادية الكبرى الاثنين معاً.
A strong dollar hurts more than a weak dollar helps
Correlation hides the shape of the relationship, so we also sorted every calendar month from September 2017 to August 2026 (108 months) by how much the broad index moved, and looked at Bitcoin in the same month. Our calculation:
| Dollar that month | Months | Bitcoin median | Bitcoin rose |
|---|---|---|---|
| Rose more than 1% | 35 | -5.9% | 12 of 35 (34%) |
| Moved less than 1% either way | 42 | +8.5% | 28 of 42 (67%) |
| Fell more than 1% | 31 | +2.8% | 17 of 31 (55%) |
Read that table slowly, because it is not what the slogan predicts. A sharply rising dollar has been a real headwind: Bitcoin lost ground in about two of every three such months. But a sharply falling dollar was close to a coin flip, and Bitcoin's best months came when the dollar barely moved at all.
The extreme months show why. In March 2020 the dollar jumped 4.1% and Bitcoin fell 24.8%, both driven by the same pandemic panic. In April 2025 the dollar fell 3.2% and Bitcoin rose 14.1%, the slogan working as advertised. But in November 2022 the dollar also fell 3.2%, and Bitcoin dropped 16.2% anyway, because that was the month the FTX exchange collapsed. A crypto-specific shock beats a friendly dollar every time.
Across all 108 months, the dollar and Bitcoin moved in the same direction 48 times and in opposite directions 60 times. The dollar tilts the odds a little, and that is about all.
الدولار القوي يضر أكثر مما ينفع الدولار الضعيف
يُخفي معامل الارتباط شكل العلاقة، لذا رتبنا أيضاً كل شهر ميلادي من سبتمبر 2017 إلى أغسطس 2026 (108 أشهر) بحسب حركة المؤشر الواسع، ونظرنا إلى البيتكوين في الشهر نفسه. حسابنا:
| الدولار في ذلك الشهر | الأشهر | وسيط البيتكوين | صعد البيتكوين |
|---|---|---|---|
| ارتفع أكثر من 1% | 35 | -5.9% | 12 من 35 (34%) |
| تحرك أقل من 1% في أي اتجاه | 42 | +8.5% | 28 من 42 (67%) |
| انخفض أكثر من 1% | 31 | +2.8% | 17 من 31 (55%) |
اقرأ هذا الجدول بتمهل، فهو لا يطابق ما تتوقعه المقولة الشائعة. فالدولار الصاعد بقوة كان عائقاً حقيقياً: خسر البيتكوين في نحو شهرين من كل ثلاثة أشهر من هذا النوع. لكن الدولار الهابط بقوة كان أقرب إلى رمية عملة، وجاءت أفضل أشهر البيتكوين حين لم يكد الدولار يتحرك.
والأشهر المتطرفة تبين السبب. ففي مارس 2020 قفز الدولار 4.1% وهبط البيتكوين 24.8%، وكلاهما بدافع ذعر الجائحة نفسه. وفي أبريل 2025 انخفض الدولار 3.2% وارتفع البيتكوين 14.1%، فعملت المقولة كما هو موعود. لكن في نوفمبر 2022 انخفض الدولار أيضاً 3.2%، وهبط البيتكوين 16.2% رغم ذلك، لأنه الشهر الذي انهارت فيه منصة FTX. فالصدمة الخاصة بالكريبتو تتغلب على الدولار المواتي في كل مرة.
وعبر الأشهر الـ108 كلها، تحرك الدولار والبيتكوين في الاتجاه نفسه 48 مرة، وفي اتجاهين متعاكسين 60 مرة. فالدولار يرجّح الكفة قليلاً، وهذا كل ما في الأمر.
How to use the dollar index without fooling yourself
- Watch weeks and months, not hours. The dollar's daily moves are tiny next to Bitcoin's, and our weekly correlation is already weak. On a daily chart, any overlap is mostly coincidence.
- Treat a strong dollar month as a warning light. It has been the worse environment for Bitcoin in our sample, especially when the cause was rising US rates or a scramble for safety.
- Do not treat a falling dollar as a buy signal. In our data it raised Bitcoin's odds only a little above even.
- Check which index you are looking at. A headline about DXY is mostly about the euro. If the story is about trade, tariffs or emerging markets, the broad index is the better gauge.
- Look for the shared cause. When the dollar and Bitcoin move hard at the same time, something bigger, like a Fed decision or a market panic, is usually driving both. Our Fed meeting explainer covers the main one.
كيف تستخدم مؤشر الدولار دون أن تخدع نفسك
- راقب الأسابيع والأشهر، لا الساعات. حركات الدولار اليومية ضئيلة بجانب حركات البيتكوين، والارتباط الأسبوعي في قياسنا ضعيف أصلاً. وعلى الرسم البياني اليومي، يكون أي تطابق مصادفة في الغالب.
- اعتبر شهر الدولار القوي ضوءاً تحذيرياً. فقد كان البيئة الأسوأ للبيتكوين في عينتنا، خاصة حين كان السبب ارتفاع الفائدة الأمريكية أو التدافع نحو الأمان.
- لا تعتبر الدولار الهابط إشارة شراء. ففي بياناتنا لم يرفع فرص صعود البيتكوين إلا قليلاً فوق التعادل.
- تحقق من المؤشر الذي تنظر إليه. العنوان الذي يتحدث عن DXY يتحدث في الغالب عن اليورو. وإن كانت القصة عن التجارة أو الرسوم الجمركية أو الأسواق الناشئة، فالمؤشر الواسع هو المقياس الأفضل.
- ابحث عن السبب المشترك. حين يتحرك الدولار والبيتكوين بقوة في الوقت نفسه، يكون هناك في العادة شيء أكبر يحركهما معاً، كقرار للفيدرالي أو ذعر في السوق. ويغطي شرحنا لاجتماع الفيدرالي أهم هذه الأسباب.
Limits of this measurement
Correlation is not causation, and a 3% share of explained variation is a reminder of how much else moves Bitcoin. Our sample starts in August 2017, when Binance's BTCUSDT data begins, so it covers one long cycle of US interest rates rather than many. BTCUSDT is priced in the Tether stablecoin, which tracks the dollar closely but is not the dollar itself. And we used the Fed's broad index, not DXY, because the Fed's series is free and public. The two move together most of the time, but as 2025 showed, not always by the same amount.
حدود هذا القياس
الارتباط ليس سببية، وحصة 3% من التباين المفسَّر تذكير بكثرة العوامل الأخرى التي تحرك البيتكوين. وعينتنا تبدأ في أغسطس 2017، حين تبدأ بيانات BTCUSDT على Binance، فهي تغطي دورة طويلة واحدة لأسعار الفائدة الأمريكية لا دورات كثيرة. وزوج BTCUSDT مُسعَّر بعملة Tether المستقرة، التي تتبع الدولار عن قرب لكنها ليست الدولار نفسه. واستخدمنا مؤشر الفيدرالي الواسع لا DXY، لأن سلسلة الفيدرالي مجانية وعامة. والمؤشران يتحركان معاً في أغلب الأوقات، لكن ليس دائماً بالقدر نفسه، كما أظهر عام 2025.