What the yield curve is
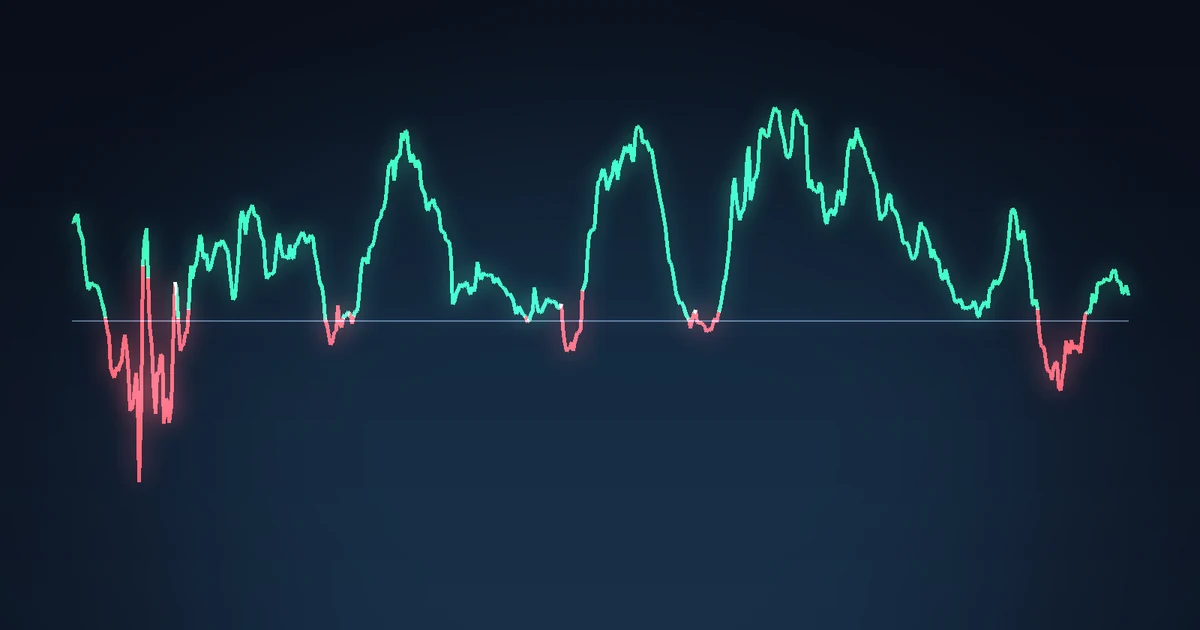
The US government borrows for every length of time, from three months to thirty years. The yield curve is simply a line through those borrowing rates, short on the left, long on the right.
Normally the line slopes upward. Lending your money for ten years ties it up longer and exposes you to more inflation risk than lending for two, so investors demand more for it. That extra yield is the term premium, and a rising curve is the healthy default.
Two spreads summarise the shape, and both are published daily by the Federal Reserve Bank of St. Louis:
| Spread | What it is | Latest, Oct 9 |
|---|---|---|
| 10s2s, series T10Y2Y | 10-year yield minus 2-year yield | +0.44 points |
| 10s3m, series T10Y3M | 10-year yield minus 3-month yield | +0.99 points |
Both are positive today: the 10-year yields 5.22%, the 2-year 4.75% and the 3-month 4.23%. The 10-year is at its highest level since June 2007.
ما منحنى العائد
تقترض الحكومة الأمريكية لكل الآجال، من ثلاثة أشهر إلى ثلاثين سنة. ومنحنى العائد ببساطة خط يمر عبر أسعار هذا الاقتراض، القصيرة على اليسار والطويلة على اليمين.
وفي العادة يميل الخط صعوداً. فإقراض مالك لعشر سنوات يقيّده مدة أطول ويعرّضك لمخاطر تضخم أكبر من إقراضه لسنتين، فيطلب المستثمرون مقابلاً أكبر. وذلك العائد الإضافي هو علاوة الأجل، والمنحنى الصاعد هو الوضع الصحي المعتاد.
ويلخّص الشكلَ فارقان، ينشرهما بنك الاحتياطي الفيدرالي في سانت لويس يومياً:
| الفارق | ما هو | آخر قراءة، 9 أكتوبر |
|---|---|---|
| 10s2s، السلسلة T10Y2Y | عائد عشر سنوات ناقص عائد سنتين | +0.44 نقطة |
| 10s3m، السلسلة T10Y3M | عائد عشر سنوات ناقص عائد ثلاثة أشهر | +0.99 نقطة |
وكلاهما موجب اليوم: عائد عشر سنوات 5.22%، وعائد سنتين 4.75%، وعائد ثلاثة أشهر 4.23%. وعائد عشر سنوات عند أعلى مستوى له منذ يونيو 2007.
What an inversion means
An inverted curve is one where short rates are higher than long rates, so the spread turns negative. It happens when the central bank holds short rates high to fight inflation while bond investors, looking further ahead, expect that tight policy to slow the economy enough that rates will have to come down later.
In plain terms, an inversion is the bond market saying: the Fed is squeezing hard now, and we think it will have to reverse. That is why it is watched as a recession warning. It is not a law of economics, it is a record of what investors expected, and its reputation comes entirely from its history.
ماذا يعني الانعكاس
المنحنى المنعكس هو الذي تكون فيه الأسعار القصيرة أعلى من الطويلة، فيصبح الفارق سالباً. ويحدث حين يُبقي البنك المركزي الأسعار القصيرة مرتفعة لمحاربة التضخم بينما يتوقع مستثمرو السندات، وهم ينظرون أبعد، أن تُبطئ تلك السياسة المشددة الاقتصاد بما يكفي لتُخفَّض الأسعار لاحقاً.
وبلغة بسيطة، الانعكاس هو سوق السندات تقول: الفيدرالي يضغط بقوة الآن، ونظن أنه سيضطر إلى التراجع. ولهذا يُراقب إنذاراً بالركود. وهو ليس قانوناً اقتصادياً، بل سجل لما توقعه المستثمرون، وسمعته كلها آتية من تاريخه.
The track record
Here is every 10s2s inversion lasting more than three weeks since 1978, and the month the next US recession began according to the National Bureau of Economic Research.
| Inversion | Length | Deepest | Recession began | Lead time |
|---|---|---|---|---|
| Aug 1978 to May 1980 | 622 days | negative 2.41 | Feb 1980 | 18 months |
| Sep 1980 to Jul 1982 | 672 days | negative 1.70 | Aug 1981 | 11 months |
| Dec 1988 to Nov 1989 | 328 days | negative 0.45 | Aug 1990 | 20 months |
| May 1998 to Jul 1998 | 62 days | negative 0.07 | none within 2 years | no signal |
| Feb 2000 to Dec 2000 | 330 days | negative 0.52 | Apr 2001 | 14 months |
| Dec 2005 to Jun 2007 | 525 days | negative 0.19 | Jan 2008 | 25 months |
| Aug 2019, three days | 3 days | negative 0.04 | Mar 2020 | 7 months |
| Apr 2022 to Sep 2024 | 888 days | negative 1.08 | none through Sep 2026 | 54 months and counting |
Five substantial inversions before 2022 and a brief one in 2019, followed by six recessions, with lead times of 11 to 25 months for the substantial ones. That is the record that made the curve famous. Two footnotes matter: the 1998 dip was too brief and shallow to count, and the 2019 signal was three days long and the recession that followed was caused by a pandemic, which no bond market predicted.
Then the last row. The 2022 inversion was the longest on record, 888 days, and the deepest since 1981. By the old rule a recession was due by 2024 at the latest. The National Bureau of Economic Research has dated none through September 2026, 54 months after the inversion began.
السجل
هذا كل انعكاس في فارق 10s2s دام أكثر من ثلاثة أسابيع منذ 1978، والشهر الذي بدأ فيه الركود الأمريكي التالي بحسب المكتب الوطني للبحوث الاقتصادية.
| الانعكاس | المدة | الأعمق | بدء الركود | الفترة الفاصلة |
|---|---|---|---|---|
| أغسطس 1978 إلى مايو 1980 | 622 يوماً | سالب 2.41 | فبراير 1980 | 18 شهراً |
| سبتمبر 1980 إلى يوليو 1982 | 672 يوماً | سالب 1.70 | أغسطس 1981 | 11 شهراً |
| ديسمبر 1988 إلى نوفمبر 1989 | 328 يوماً | سالب 0.45 | أغسطس 1990 | 20 شهراً |
| مايو 1998 إلى يوليو 1998 | 62 يوماً | سالب 0.07 | لا شيء خلال سنتين | لا إشارة |
| فبراير 2000 إلى ديسمبر 2000 | 330 يوماً | سالب 0.52 | أبريل 2001 | 14 شهراً |
| ديسمبر 2005 إلى يونيو 2007 | 525 يوماً | سالب 0.19 | يناير 2008 | 25 شهراً |
| أغسطس 2019، ثلاثة أيام | 3 أيام | سالب 0.04 | مارس 2020 | 7 أشهر |
| أبريل 2022 إلى سبتمبر 2024 | 888 يوماً | سالب 1.08 | لا شيء حتى سبتمبر 2026 | 54 شهراً وما زال العدّ |
خمسة انعكاسات معتبرة قبل 2022 وانعكاس قصير في 2019، تبعتها ستة ركودات، بفترات فاصلة من 11 إلى 25 شهراً للمعتبرة منها. وهذا هو السجل الذي صنع شهرة المنحنى. وهامشان مهمان: انخفاض 1998 كان أقصر وأضحل من أن يُحتسب، وإشارة 2019 دامت ثلاثة أيام والركود الذي تلاها سببته جائحة، وهو ما لم تتنبأ به أي سوق سندات.
ثم الصف الأخير. كان انعكاس 2022 الأطول في السجل، 888 يوماً، والأعمق منذ 1981. وبحسب القاعدة القديمة كان الركود مستحقاً بحلول 2024 على أبعد تقدير. ولم يؤرّخ المكتب الوطني للبحوث الاقتصادية أي ركود حتى سبتمبر 2026، بعد 54 شهراً من بدء الانعكاس.
Why the signal may have failed this time
Nobody can prove it, but three explanations are widely discussed.
The inversion came from the short end. The Fed lifted short rates from near zero to over 5% in about a year, the fastest pace in four decades. The curve inverted because short rates leapt, not because long-term growth expectations collapsed, which is a weaker recession message.
Households and companies had locked in cheap money. Fixed-rate mortgages and long corporate bonds taken out in 2020 and 2021 shielded much of the economy from higher short rates for years.
Heavy government borrowing pushed the long end up. Large deficits keep long yields higher than growth alone would justify, and a curve that is steepening for that reason says little about recession.
The honest summary is that the yield curve is a record of expectations, and expectations can be wrong. A signal that was right six times and then early by at least 30 months is still informative. It is no longer a timing tool.
لماذا ربما أخفقت الإشارة هذه المرة
لا أحد يستطيع إثبات ذلك، لكن ثلاثة تفسيرات تُناقش على نطاق واسع.
جاء الانعكاس من الطرف القصير. فقد رفع الفيدرالي الأسعار القصيرة من قرب الصفر إلى أكثر من 5% في نحو سنة، أسرع وتيرة منذ أربعة عقود. فانعكس المنحنى لأن الأسعار القصيرة قفزت، لا لأن توقعات النمو طويل الأجل انهارت، وهذه رسالة ركود أضعف.
الأسر والشركات ثبّتت مالاً رخيصاً. فالرهون العقارية بفائدة ثابتة والسندات الطويلة للشركات التي أُخذت في 2020 و2021 حمت جزءاً كبيراً من الاقتصاد من الأسعار القصيرة الأعلى لسنوات.
الاقتراض الحكومي الثقيل دفع الطرف الطويل إلى الأعلى. فالعجوزات الكبيرة تبقي العوائد الطويلة أعلى مما يبرره النمو وحده، ومنحنى يزداد انحداراً لهذا السبب لا يقول الكثير عن الركود.
والخلاصة الأمينة أن منحنى العائد سجل للتوقعات، والتوقعات قد تخطئ. وإشارة أصابت ست مرات ثم سبقت أوانها بثلاثين شهراً على الأقل ما زالت مفيدة. لكنها لم تعد أداة توقيت.
What Bitcoin did through the longest inversion
Bitcoin has only existed through two inversions, so there is not much history to measure. The 2022 to 2024 episode is the one that matters, and it is instructive.
| Moment | Date | Bitcoin |
|---|---|---|
| Curve inverts | Apr 1, 2022 | $46,283 |
| Low during the inversion | Nov 21, 2022 | $15,781 |
| High during the inversion | Mar 13, 2024 | $73,072 |
| Curve turns positive | Sep 5, 2024 | $56,180 |
| Latest | Oct 10, 2026 | $83,097 |
Across the full inversion Bitcoin gained about 21%, but the path went through a 66% fall to the November 2022 low and then a 363% rise to the March 2024 high. Since the curve turned positive it has added another 48%.
Two lessons. First, the inversion told you nothing useful about Bitcoin's direction: the worst crash and one of the best rallies both happened inside it. Second, the much-discussed danger moment for stocks, the re-steepening after an inversion ends, has so far coincided with a Bitcoin rise rather than a fall. One episode is not a pattern, and we are not presenting it as one.
ما فعله البيتكوين خلال أطول انعكاس
لم يعش البيتكوين سوى انعكاسين، فليس هناك تاريخ كثير للقياس. وحلقة 2022 إلى 2024 هي المهمة، وهي مفيدة.
| اللحظة | التاريخ | البيتكوين |
|---|---|---|
| انعكاس المنحنى | 1 أبريل 2022 | $46,283 |
| القاع خلال الانعكاس | 21 نوفمبر 2022 | $15,781 |
| القمة خلال الانعكاس | 13 مارس 2024 | $73,072 |
| عودة المنحنى إلى الموجب | 5 سبتمبر 2024 | $56,180 |
| آخر قراءة | 10 أكتوبر 2026 | $83,097 |
عبر الانعكاس كاملاً ربح البيتكوين نحو 21%، لكن الطريق مر بهبوط 66% إلى قاع نوفمبر 2022 ثم صعود 363% إلى قمة مارس 2024. ومنذ عودة المنحنى إلى الموجب أضاف 48% أخرى.
ودرسان. أولاً، لم يخبرك الانعكاس بشيء مفيد عن اتجاه البيتكوين: فأسوأ انهيار وأحد أفضل الصعودات حدثا كلاهما داخله. ثانياً، اللحظة الخطرة التي يكثر الحديث عنها للأسهم، أي إعادة الانحدار بعد انتهاء الانعكاس، تزامنت حتى الآن مع صعود للبيتكوين لا هبوط. وحلقة واحدة ليست نمطاً، ولا نعرضها كذلك.
How to read the curve yourself
Use both spreads. Many economists, including researchers at the New York Fed, prefer 10s3m to 10s2s because the 3-month rate tracks Fed policy more directly. When they disagree, treat the signal as weaker.
Watch duration, not a single day. The 2019 inversion lasted three days. Meaningful signals have lasted months.
Look at why it moves. A curve steepening because long yields rise on deficit worries means something different from one steepening because short rates fall in a rate-cutting panic.
The data is free. FRED series T10Y2Y, T10Y3M, DGS10 and DGS2 update every business day.
كيف تقرأ المنحنى بنفسك
استخدم الفارقين معاً. يفضّل كثير من الاقتصاديين، ومنهم باحثون في فيدرالي نيويورك، فارق 10s3m على 10s2s لأن سعر الثلاثة أشهر يتبع سياسة الفيدرالي مباشرة أكثر. وحين يختلفان، اعتبر الإشارة أضعف.
راقب المدة لا يوماً واحداً. فانعكاس 2019 دام ثلاثة أيام. والإشارات ذات المعنى دامت أشهراً.
انظر لماذا يتحرك. فمنحنى يزداد انحداراً لأن العوائد الطويلة ترتفع بسبب القلق من العجز يعني شيئاً مختلفاً عن منحنى يزداد انحداراً لأن الأسعار القصيرة تهبط في ذعر خفض الفائدة.
البيانات مجانية. سلاسل FRED وهي T10Y2Y وT10Y3M وDGS10 وDGS2 تُحدَّث كل يوم عمل.